It’s become a common assumption that US infrastructure is in a poor state of repair; that our roads, bridges, pipes, and transmission lines are decaying faster than they’re being repaired or replaced. This concern goes back to the early 1980s, when the book "America in Ruins" was published, triggering concern about America's "crumbling infrastructure.”
Today, this belief is reinforced by the American Society of Civil Engineers (ASCE) Infrastructure Report Card, which grades various aspects of US physical infrastructure and invariably finds that massive investment in rehabilitation and repair is needed.
One facet of infrastructure that often gets attention is bridges, particularly when one fails catastrophically. Because transportation in the US is so heavily car-based, bridges are a critical part of transportation infrastructure. The US has more than 600,000 bridges that carry on average more than 8000 cars a day1. Bridges are important enough that a collapsed bridge is one of the few things that the US will still build quickly.
What's the current status of the US's bridges? Are they getting better or worse over time? Let's take a look.
The state of US bridges
For data, we’ll use the Federal Highway Administration’s National Bridge Inventory (NBI), a database of every bridge in America, updated yearly since 1992. For each bridge, the NBI records a variety of information, such as the type of bridge, its location, its daily traffic, and when it was built. It also includes inspection data: bridge inspectors grade the deck (the driving surface), the superstructure (the bridge itself), and the substructure (the bridge’s supporting elements) on a 10-point scale, with 9 being “excellent condition” and 0 being “failed.”
To start, the number of bridges in the US is slowly increasing over time. Since 2010 the US has added slightly over 1000 bridges a year on net.
An aside: It's not clear to me if the large decline during the financial crisis years of 2008-2010 is real (if, say, new bridge construction dramatically decreased so demolitions greatly outpaced them) or just some sort of data encoding issue.
Even though we're building more bridges, traffic volume is increasing faster: bridges are carrying more and more traffic over time. The average daily traffic of US bridges has risen from 5400 cars a day in 1992 to more than 8400 cars a day in 2023, an increase of more than 50%.
Bridges are also getting older. In 1992, the average bridge was about 36 years old. Today, it's almost 46 years old. Between 2000 and 2020, the number of bridges more than 80 years old more than doubled, from just under 26,000 to more than 56,000.
If we look at year of construction, we see a peak in the 1960s, with a decline since then. The US has almost twice as many bridges built in the 1960s as the 2010s. We also see a big “hole” in the 1940s, presumably due to WWII. And over 3,000 bridges in the US are more than 120 years old.
Since bridges are both getting older and handling more traffic, we might expect their condition to get worse as they accumulate more wear and tear. We do see a very slight decline in the average rating of deck, substructure, and superstructure since the mid-aughts (prior to that, average rating was increasing over time). Note the vertical axis here: this decline is VERY slight.
A rating of between 6 and 7 corresponds to the average bridge being somewhere between 'good' and 'satisfactory', more or less in-line with the ASCE's rating of "C" for our bridges in the most recent infrastructure report card.
However, if we take a more granular look at the ratings, the picture changes somewhat. If we restrict ourselves to the bridges in the worst condition, we see that their numbers have steadily declined: there are fewer terrible bridges than ever. In every category (deck, superstructure, and substructure), the number of bridges rating less than 5 (ie: “poor” or worse) has declined steadily over time, falling by roughly 20% since 1992.
And the steepest declines have come from the worst-rated bridges. Between 1992 and 2023, the number of bridges with a condition rating less than 3 ("critical condition" or worse) has declined by more than 70%:
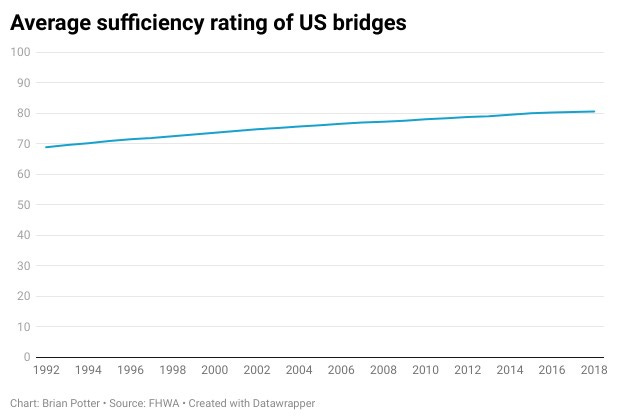
We see a similar story if we look at the "sufficiency rating," which is intended to provide an overall evaluation of bridge quality. Sufficiency rating combines structural condition (ie: deck, substructure and superstructure rating) with serviceability factors, such as roadway width and vertical clearances. Sufficiency ratings have increased steadily since 1992, from just under 69% in 1992 to over 80% in 2018 (the last year FHWA provides this data).

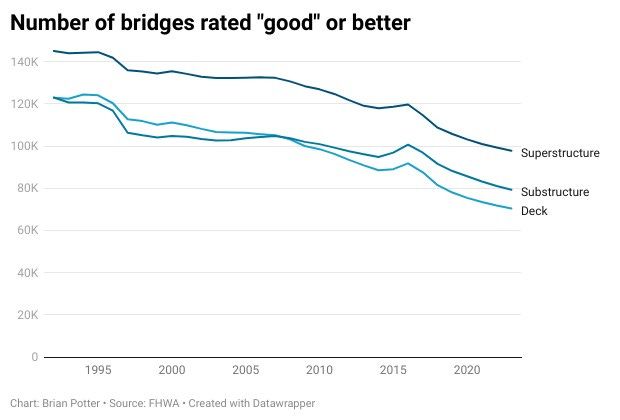
The reason that average quality has declined even as the worst bridges get repaired, replaced or removed is that we also have fewer high quality bridges. The number of bridges rated 7 or above ("good, very good, or excellent") has declined by more than 30% since 1992.
In other words, US bridges have gotten more average over time. Excellent bridges are accumulating wear and tear and becoming “fair," while heavily decayed or damaged ones are getting repaired or replaced. This strikes me as basically the correct way to allocate highway resources. A bridge in "fair" condition doesn't work any less well than one in excellent condition, so it makes sense to focus resources on the bridges that are the most heavily damaged.
This basic picture doesn't change much if we only look at the high-traffic bridges. Here are the bridges with a less than 3 superstructure rating (deck and substructure graphs look similar) for bridges with a daily traffic greater than 5000.
Not much seems to change if we look at individual states. Here are bridges with a 3 or less superstructure rating for the states of New York, California, Florida, Texas, and Pennsylvania (once again deck and substructure graphs look similar).
(The huge spike in New York in the early 2000s is presumably some sort of data coding error).
To sum up, bridges in the US are getting more "average" over time. We have fewer excellent bridges, but we also have many fewer bridges in poor condition. We're fixing our worst bridges, rather than spending money keeping bridges looking sparkling and new. Because the difference between a poor quality bridge and an "average" bridge is much larger than an average and an excellent bridge (since a poor quality bridge is at risk of collapse), this means that bridge infrastructure is getting safer over time, even as it gets older and handles more traffic.
It’s hard to make sense of this statistic, since it implies that every day US bridges carry nearly 5 billion cars, which seems like an implausibly high number. This would require every car in the US to cross 16 bridges every day.


Overpass Georg, who crosses 10,000 bridges per hour, 12 hours per day, is an outlier and should not be counted.
Question: does a highway overpass count as a bridge in this analysis?