

Trends in US Construction Productivity
(This is a chapter of a longer report I’m working on that summarizes and expands the last several years of my work on construction productivity. I plan on publishing one chapter a month on the newsletter, and aim to have the full report done by the end of the year.)
For decades, American construction has fallen behind almost every other major sector in productivity growth. As far back as 1970 researchers noted that construction productivity improvement significantly lagged productivity improvement in the economy overall, and by 1985 economists were investigating what appeared to be declining construction productivity. Stanford civil engineering professor Paul Teicholz noted in a 2004 article in AECbytes that between 1964 and 2004, construction productivity declined by 0.59% per year on average, which was “particularly alarming when compared to the increasing labor productivity in all non-farm industries, which have experienced an increasing productivity of 1.77%/year over the same time period.” A 2017 article in The Economist noted that “construction holds the dubious honour of having the lowest productivity gains of any industry.” In a 2023 New York Times column, Ezra Klein wrote that “A construction worker in 2020 produced less than a construction worker in 1970, at least according to the official statistics.”
The trend of construction productivity in the United States failing to improve over time is indeed concerning. “Productivity” means some measure of output, divided by some measure of input. When productivity is improving, we get more output for a given amount of input over time; if productivity is falling, we get less output for a given amount of input over time. If productivity doesn’t improve, we can’t expect construction costs to fall and things like houses, roads, and bridges to get any cheaper. Because of this, it’s worth looking deeply at what exactly the trends in US construction productivity are.
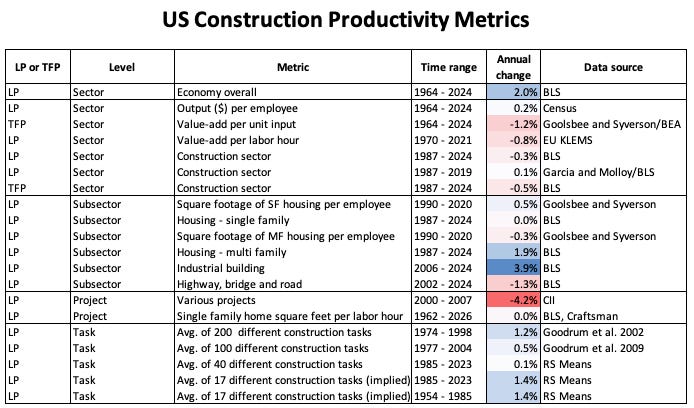
Economists and researchers measure construction productivity in a variety of different ways. We can broadly categorize these metrics by their level of granularity:
At the lowest level of granularity, we have metrics that track productivity changes across the entire construction sector.
Slightly more granular are metrics that look at productivity changes in a particular subsector, such as housing construction.
Looking more specifically, we have metrics that look at productivity changes for constructing particular buildings.
And finally we have metrics that track productivity changes for individual construction tasks.
Each category of metric gives a slightly different perspective on productivity trends, and each has its own measurement challenges that we must consider when interpreting the data.
Sector-wide productivity metrics
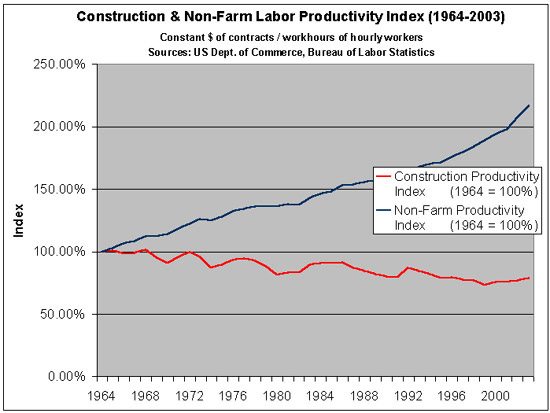
Sector-wide productivity metrics look at productivity trends across the entire construction industry. They answer if, overall, we’re getting more or less construction output for a given amount of input. The graph below, for instance, shows trends in US construction productivity by using total construction spending as a measure of output, and total hours worked in the construction sector as a measure of input. (Spending has been adjusted to 2025 dollars using the Consumer Price Index —we’ll talk more about whether this is a reasonable way to adjust for inflation later.)
We can see that, per this metric, construction labor productivity — the amount of construction output we get for a given amount of labor — is virtually flat between 1964 and 2024, whereas labor productivity in the economy overall rose by a factor of three.
Sector-wide metrics which look at productivity trends across the entire construction industry are very common. Paul Teicholz uses the same data we used above to look at trends in construction productivity in a 2013 article, and his 2004 article uses a very similar metric (rather than total spending, he uses US Department of Commerce construction spending data, a subset, as a measure of output).
In their 2025 paper “The Strange and Awful Path of Construction Productivity in the US”, economists Austan Goolsbee and Chad Syverson use a slightly different sector-wide productivity metric. For output they use real (inflation-adjusted) construction value-add data from the Bureau of Economic Analysis, and for input they use the number of full-time construction employees. (Unlike total construction spending, which just tracks the value of the outputs, value-add measures the value of construction outputs minus the value of the inputs used.) Goolsbee and Syverson also look at trends in construction total factor productivity (TFP), which measures productivity of both labor and capital (equipment, machinery, etc.) by comparing the growth rates of real construction value-add to the growth rates of construction labor and capital inputs. According to Goolsbee and Syverson’s productivity metrics, construction productivity looks even worse. Productivity increased from the 1950s until the mid-1960s, but since then it has declined by roughly 50%.
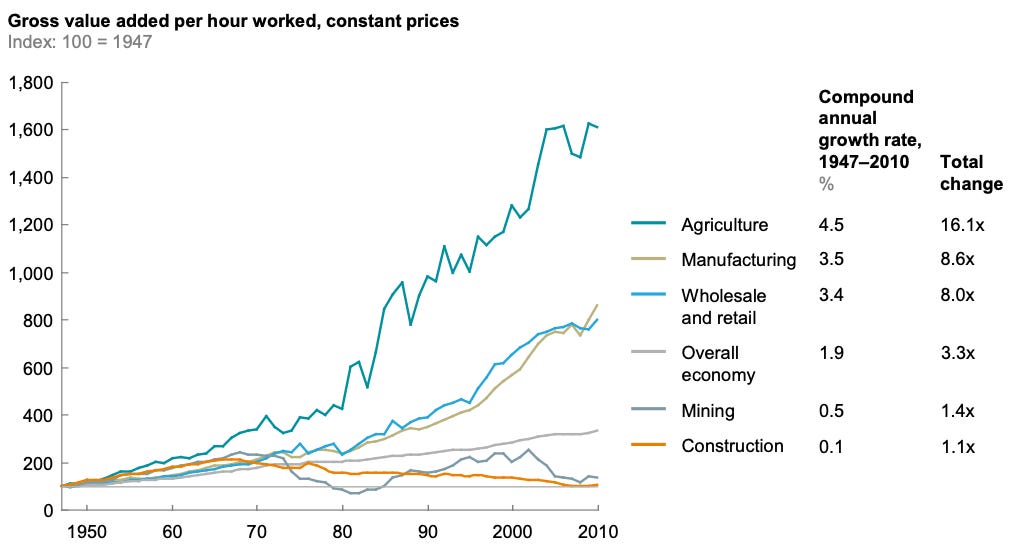
Discussions of US construction productivity often reference this Goolsbee and Syverson paper, or the data behind it. An early version of Goolsbee and Syverson’s paper is what Ezra Klein is referring to in his 2023 New York Times column, and it’s referred to in a 2025 Federal Reserve Economic Brief examining productivity. The data is also used in a 2026 report from Goldman Sachs looking at the causes of low US construction productivity. Management consultancy McKinsey likewise uses BEA value-add data in a 2017 report to construct a similar productivity metric, gross value add per hour worked, to show that in the US construction productivity improvement had lagged virtually every other industry:
The Bureau of Labor Statistics also uses BEA data, combined with its own estimates of hours worked, to calculate trends in both labor productivity and total factor productivity for a variety of sectors, including construction. This metric likewise shows construction productivity as stagnant or declining. It’s not uncommon for discussions of productivity to also reference this BLS metric; for instance, it’s used by Federal Reserve economists Daniel Garcia and Raven Molloy in their 2025 paper “Reexamining Lackluster Productivity Growth in Construction”.
Sector-wide measures of US construction productivity thus tell a consistent story of stagnant productivity growth, differing only in how bad the problem appears. By some measures, productivity is merely flat over the last several decades; by others, productivity has declined significantly.
Sub-sector productivity metrics
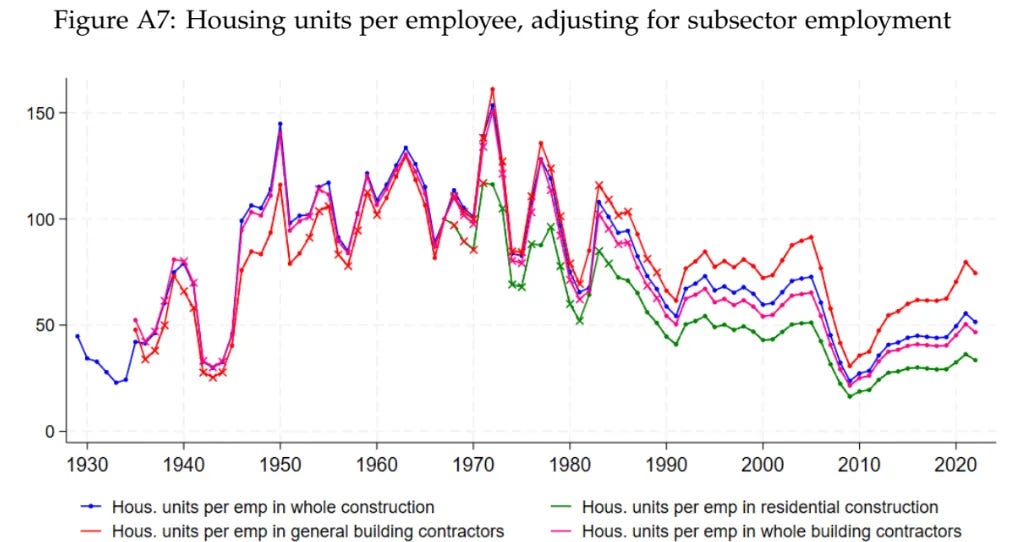
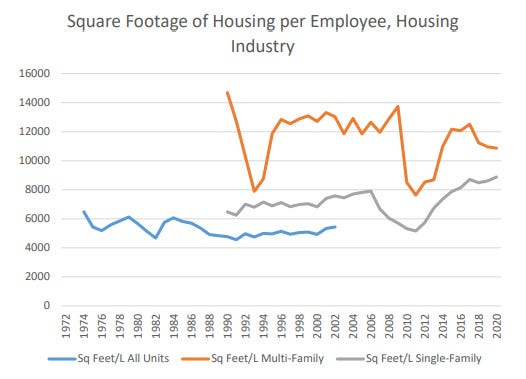
Subsector metrics are also commonly used to get a picture of national construction productivity trends, particularly metrics that look at trends in housing construction. In their 2023 NBER working paper, “Why Has Construction Productivity Stagnated?” Princeton economist Leonardo D’Amico and coauthors looked at productivity trends in US homebuilding by dividing the total number of housing units produced in the US by the total number of residential construction employees. They found that housing productivity had declined significantly since the 1960s — though, as we’ll see, there are issues with their choice of metric. Goolsbee and Syverson also looked at housing units per employee in their 2025 paper, along with another housing productivity metric, square footage of housing per employee. As with D’Amico et al., housing units per employee shows declining productivity over time, while square feet per employee shows slightly more complex trends: productivity appears to decline between the 1970s and the early 1990s, and decline since then for multifamily construction, but single-family construction shows an increase in productivity of close to 50% between 1990 and 2020. In their 2025 paper, Garcia and Molloy also look at productivity trends in single-family home construction using square footage of housing produced per employee, though they also try to include quality adjustments in this metric. (We’ll discuss quality adjustments more later.)
The Bureau of Labor Statistics also produces estimates for construction productivity trends for four sub-sectors: single-family home construction, multifamily home construction (i.e., apartment buildings), industrial building construction, and highway and bridge construction. These are based on individual subsector estimates of construction spending from the US Census, and BLS estimates of hours worked. Per the BLS, while single-family home productivity has been stagnant since 1987 and highway and bridge productivity has declined, productivity is up for both multifamily construction and for industrial building construction.
Construction subsector productivity estimates thus generally show stagnant or declining construction productivity, though with significant variation. Some subsectors show increasing productivity, and some show different trends by different metrics. Single-family home construction shows increasing productivity when measured by square feet of home per employee, but unchanging productivity when measured by subsector spending per labor hour; for multifamily home construction, the reverse is true.
Project and building productivity metrics
Below the level of construction subsectors, we have productivity metrics that look at trends for individual building types, such as the amount of labor required to build a single-family home. These sorts of metrics are much less common, as it’s rare to get detailed project-level productivity data from builders, but are still seen occasionally. In 1964 and 1972 the Bureau of Labor Statistics conducted studies on the number of hours it took to build a single-family home, finding that the average annual percent change in labor hours per square foot was just -0.6% per year (ie: productivity increased, but slowly). The Construction Industry Institute has a “Benchmarking and Metrics Productivity Database” that tracks project-level productivity metrics for submitted projects. A NIST analysis of this database from 2000 to 2007 noted a decline in project-level productivity, measured in output in dollars per labor-hour.
We can construct our own building-level productivity metric by using data from construction estimating guides. Estimating guides, produced by companies like RS Means and Craftsman, provide information on cost, labor, and material requirements for hundreds of different construction tasks, and are used to generate cost estimates for new construction projects. Some companies have also often been producing their estimating guides for many years, making them a valuable tool for analyzing productivity trends; both RS Means and Craftsman have been producing estimating guides since the 1950s.
Starting in 1993, Craftsman’s National Construction Estimator included an estimate of the total number of hours required to build a “typical” single-family home. If we compare the estimated number of hours per square foot in 1993 and 2026, they’re almost identical. The only task that has changed is insulation installation, which took a single man six days in 1993 and now takes one man 3 days. It’s also worth noting that this hours per square foot figure is also virtually the same as the number of hours per square foot calculated by the BLS in their 1964 and 1972 studies.
Thus, project-level measurements of US construction productivity also tend to show a stagnation or a decline in US construction productivity over time.
Task-level productivity metrics
Finally, below project-level productivity metrics, we have measures that look at productivity of individual construction tasks: laying bricks, framing walls, installing plumbing, and so on. These metrics are fairly commonly used, thanks to the existence of estimating guides. We can look at changes in task-level construction productivity by seeing how the time and labor required for various specific construction tasks has changed in estimating guides over time.
Allmon et al (2000) looked at productivity changes for 20 different construction tasks from 1974 through 1996 using RS Means estimating guide data, and found that labor productivity increased for seven tasks, decreased for two tasks, and was unchanged for 11 tasks. Goodrum et al (2002) looked at productivity changes between 1976 and 1998 for 200 different construction tasks using data from several different estimating guides. They found that labor productivity declined for 30 tasks, was unchanged for 64 tasks, and improved for 107 tasks, with an average growth rate in labor productivity ranging from 0.8% to 1.8% depending on the estimating guide. A follow up study by Goodrum in 2009 that looked at productivity trends in 100 different construction tasks between 1977 and 2004 found a somewhat lower average productivity increase of just 0.47% per year, with significant variation between task categories.
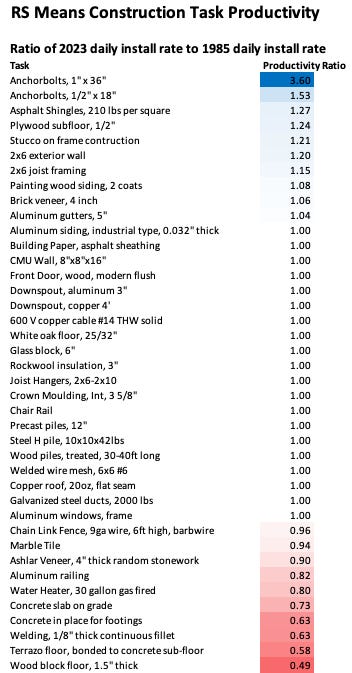
We can also use different versions of estimating guides to do our own analysis of productivity trends. The chart below shows the relative installation rates for 40 different construction tasks which are listed in the RS Means estimating guides from 1985 and 2023. 10 tasks got more productive over the period, 10 got less productive, and 20 tasks were unchanged.
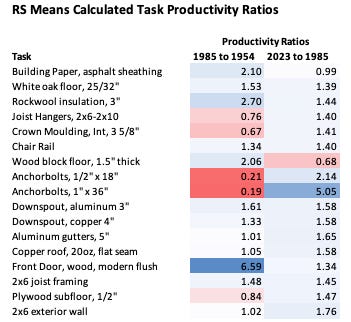
We can also try to calculate installation rates directly, using the values RS Means lists for task labor cost and hourly wages. The chart below shows the installation rates calculated for 17 construction tasks performed by either carpenters or sheet metal workers that were listed in the 1954, 1985, and 2023 version of the RS Means estimating guide.1 Effective installation rates for each task were calculated by dividing unit labor costs for the task by the average worker wage for that task type. By this analysis, 12 of 17 tasks improved in productivity between 1954 and 1985, and 15 of 17 tasks between 1985 and 2023 got more productive.
One challenge with task-level productivity metrics is that we should expect a major mechanism of productivity improvement to be replacing old tasks for new ones. Steel manufacturing became massively more productive with the introduction of the Bessemer process, which took much less time and effort than the previous cementation process, but a task-level analysis — seeing how productivity in the cementation process improved over time — wouldn’t capture this.
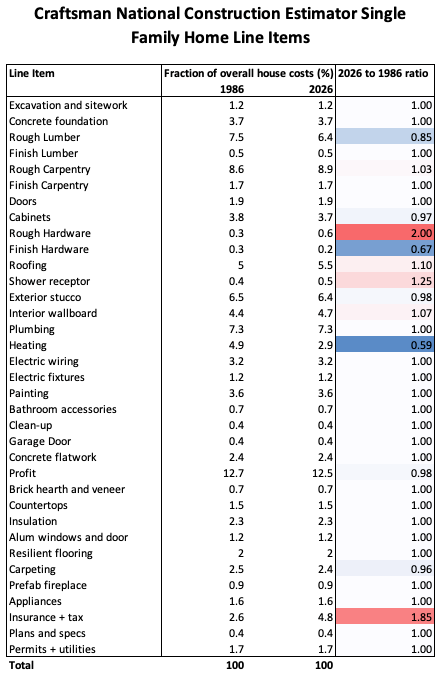
One way around this is to look at the categories of tasks necessary for completing a building, rather than specific tasks. We can do this using Craftsman’s National Construction Estimator, which includes a breakdown of what’s necessary to complete a single-family home — excavation, installing doors and windows, running wiring, etc. — and what fraction of the total cost to build a home they make up. By looking at changes in these fractions of total home cost over time, we can see which sorts of tasks have gotten more productive and which have gotten less productive.
The chart below shows the relative fraction of different categories of tasks needed to build a single-family home for 1986 and 2026. Overall, there’s surprisingly little change: most task categories have the same ratio of overall costs in 1986 as they were in 2026, suggesting few types of tasks overall had much change in productivity.
Overall task-level productivity analysis shows significant variation in productivity trends. Looking at published installation rates for several dozen construction tasks between 1985 and 2023 implies that, as with other measures, construction productivity has shown little to no increase. Looking at high-level tasks needed to complete a single-family home also shows few tasks that have improved in productivity. But other analyses yield different results. Calculating implied installation rates using labor costs suggests significant task-level productivity improvement over time. Likewise, various studies of installation rates show construction tasks improving in productivity on average from the 1970s through the 1990s (with rate of improvement perhaps falling off over time).
International productivity measures
The above metrics of construction productivity all look at trends in US construction. However, it’s also worth understanding construction productivity trends in other countries. If other countries show substantial construction productivity improvements, that suggests that the US’s productivity challenges are something specific to the US. But if other countries show stagnant or declining construction productivity, that suggests the challenges may be due to broader trends, or to the nature of the process of construction itself.
We can look at international trends in construction productivity at the sector level by using KLEMS databases, which aggregate industry-level productivity data for countries around the world.2 EU KLEMS has productivity data for European countries, as well as the US, UK, Japan, and (for older releases) Korea, Canada, and Australia. Asia KLEMS has productivity data for Japan, Korea, Taiwan, and India. LA KLEMS has productivity data for several Latin American countries, and World KLEMS has links to Russian, Chinese, and Canadian KLEMS data.3
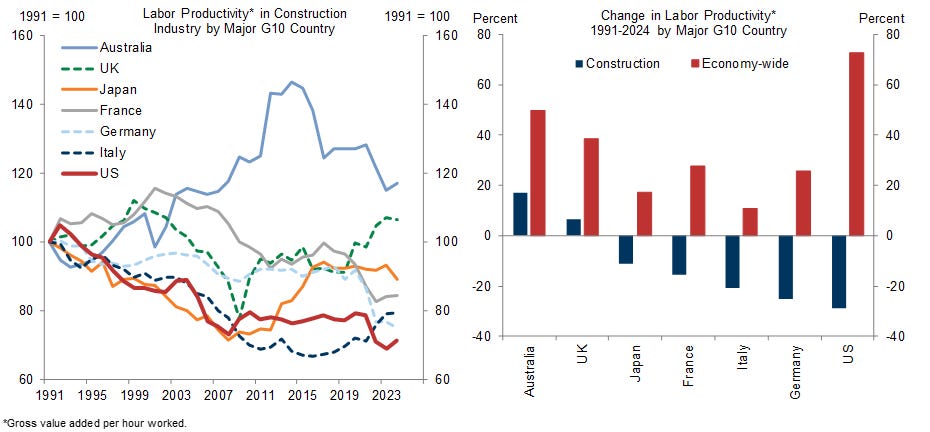
The charts below show changes in construction labor productivity, measured as gross value add per labor hour, for 45 different countries. Productivity has been normalized to equal 100 for the first year in which there’s data.
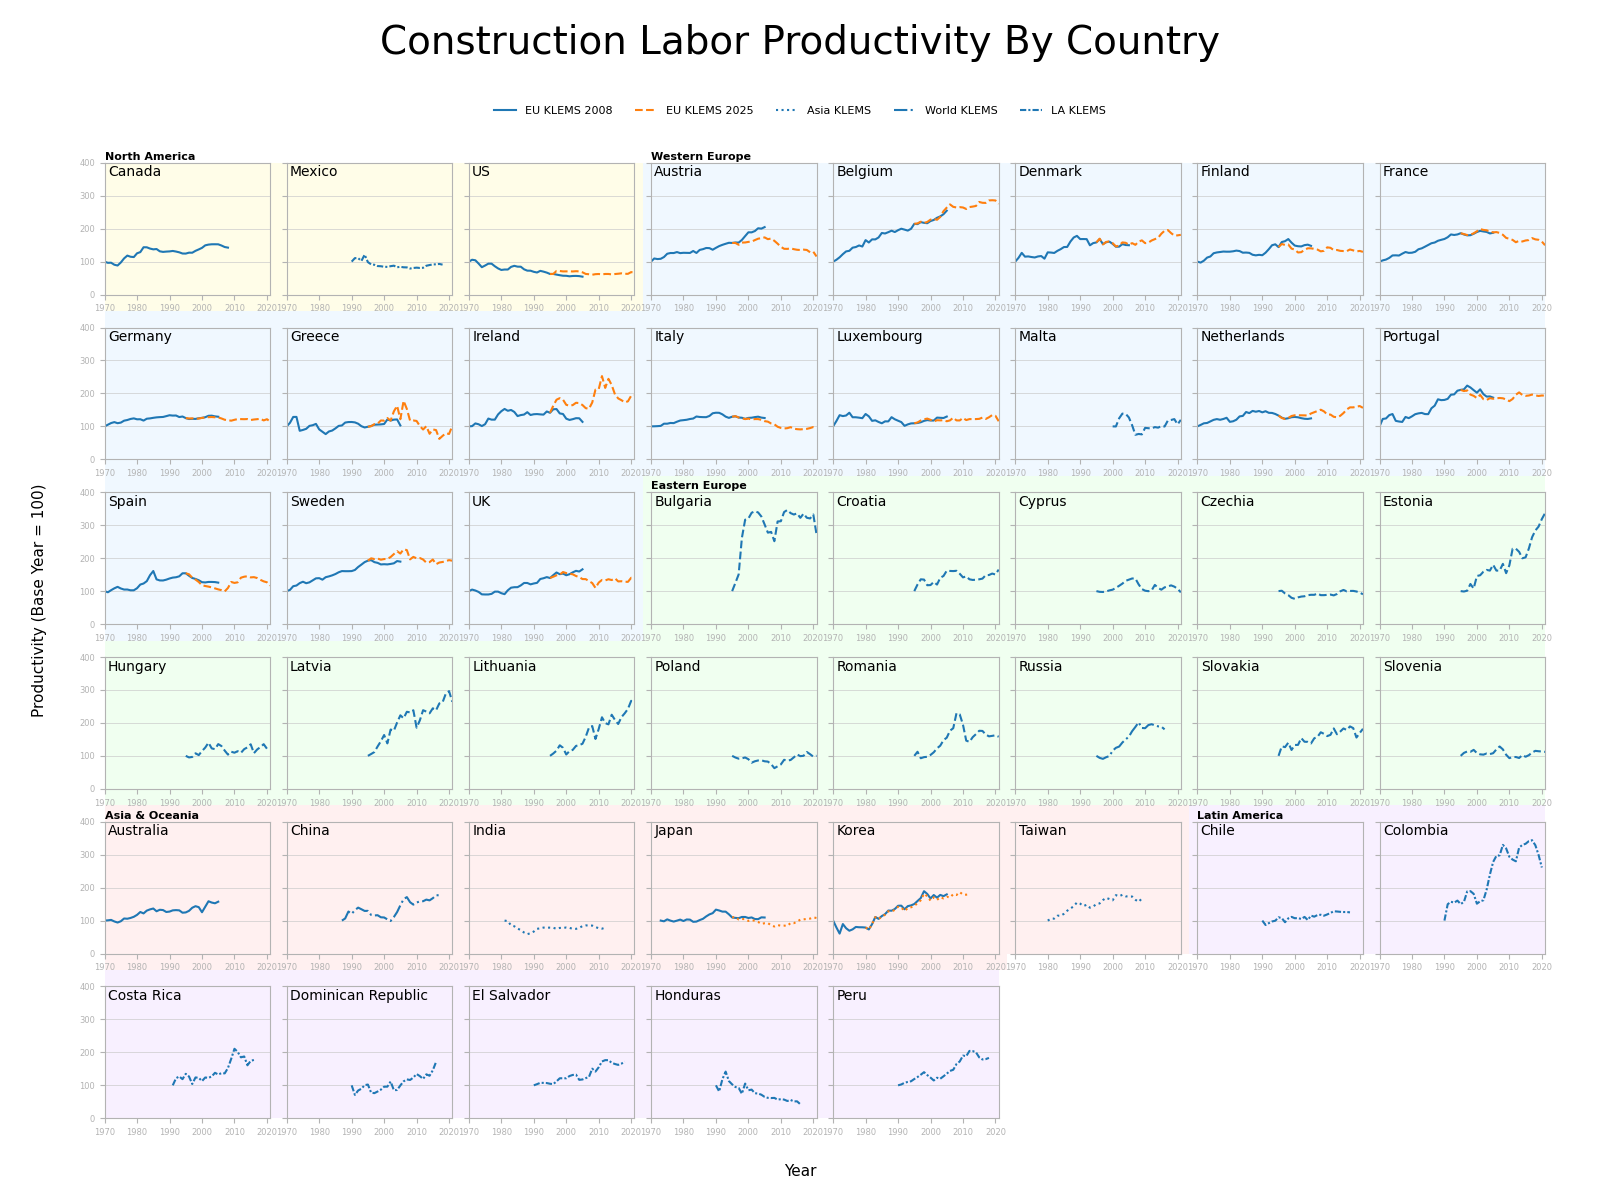
Per KLEMS data, US construction productivity steadily declined from 1970 to around 1995, after which it leveled off. This is broadly consistent with other measures of US construction-sector productivity, which show either stagnant or declining productivity since roughly the 1960s.
Other countries show a somewhat different historical pattern. For the 20 countries where data goes back to the 1970s (which includes most of Western Europe, the Anglosphere, Japan, and Korea), only one other country, Greece, shows declining construction productivity from 1970 to 1995, and its rate of decline is much lower than the US. Every other country saw rising construction productivity during that period.
Since 1995, however, construction productivity in these 20 countries (minus Canada and Korea, whose time series stopped around 2010) improved much less. Per KLEMS, the US has an average annual rate of improvement of 0.2% per year from 1995 to 2021, which is slightly better than average for this group of 18 countries. Only Belgium and Ireland have maintained a steady, high rate of construction productivity improvement greater than 1% per year.
Starting in the 1980s, there is also KLEMS data for China, Taiwan, and India, and starting in the 1990s there’s data for Eastern Europe, Latin America, and Russia. Taiwan shows improving productivity until around 2000, after which it flattens out/declines. Korea and Russia show similar patterns of improvement followed by stagnation. India’s productivity improvement has remained flat, as has Poland’s, Czechia’s, Malta’s, Cyprus’ and Slovenia’s. Other Eastern European countries have improved in construction productivity since the 1990s, as have Latin American countries (with the exception of Honduras, which has declined significantly over time).
China’s productivity improved from the late 1980s through the 2010s, though its rate of improvement does not appear to be particularly impressive. (It’s roughly similar to the historical rates of improvement seen in Korea, France, Sweden, or Portugal.)
Goldman Sachs also looked at international construction productivity for several large, wealthy countries in a 2026 report. While they also found poor records of construction productivity for most countries since 1990, per their analysis the US had the worst record of construction productivity improvement of any country analyzed. This appears to stem in part from using BEA data for US productivity calculations, which yield a greater productivity decline than other US productivity metrics.
Overall, international construction-sector productivity data suggests that the US is not alone in suffering from stagnant or declining construction sector productivity. Rates of productivity improvement in the US over the last several decades appear broadly similar to improvement rates observed in other large, wealthy countries. Many countries that at one point had substantially improving construction productivity (Western Europe, Korea, Taiwan) have seen it flatten out in recent years. Others (India, Japan) have never seen substantial improvements. The countries that do show sustained, large improvements tend to be either small (Ireland, Denmark, Estonia), poor (Colombia, Peru), or both. Rates of construction productivity improvement are nearly always much lower than improvements seen in manufacturing, or in the economy overall.
Challenges with measuring construction productivity
Accurately measuring trends in construction productivity means accurately measuring both inputs and outputs over time. There are a number of difficulties in doing this.
For outputs, one major challenge is that outputs might change over time in ways that are difficult to account for. Sector-wide measures of construction productivity, for instance, typically measure construction output in terms of total construction spending, tallying up everything that was spent on construction during the year — housing in Texas, skyscrapers in New York, schools in Washington, and so on. However, if the composition of things that are built in the country changes — if over time there are more homes built in Texas and fewer skyscrapers built in New York — this could distort productivity measures.
For example, assume there are two types of houses, Type A which requires 1000 hours of labor to produce, and Type B which requires 1500 hours of labor to produce. Last year 100 of each type of house were built, yielding 200 total houses built with 250,000 hours of labor. The next year, however, 50 Type A houses and 150 Type B houses were built, yielding 200 total houses built with 275,000 hours of labor. If you simply look at the outputs (200 houses each year) without accounting for the differing difficulty of building them, this looks like a roughly 9% decline in productivity, since it took more hours to build the same number of houses. But what’s actually happened is a shift to building fewer easy to build houses and more hard to build houses. You could in fact get a measured productivity decline even if productivity was improving for each type of house. This is a variation of Simpson’s Paradox, the observation that for groups with differences between them, trends in individual sub-groups can be reversed when looking at the groups collectively.
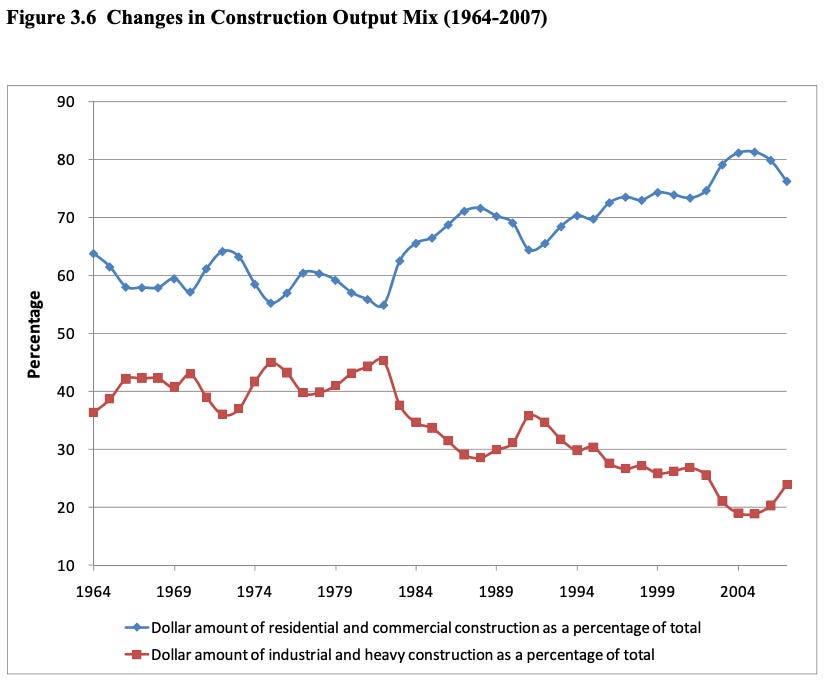
These effects of a changing output mix aren’t merely theoretical. When Allen (1985) looked at US construction productivity trends from 1968 to 1978, he found that this sort of change in the output mix — specifically, a shift from capital-intensive civil construction to labor intensive home construction — was responsible for the lion’s share of the measured productivity decline.
This sort of shift in the output can also be at work in sub-sector measures of construction productivity. Measures of housing sector productivity, for instance, can be distorted by failing to account for changes in what sort of housing gets built. D’Amico et al. (2023) used “housing units per employee” as a measure of construction productivity, but this measure fails to take into account the fact that on average houses increased in size over time. An average home in 2025 is much larger, and requires more effort to build, than an average home in 1985.
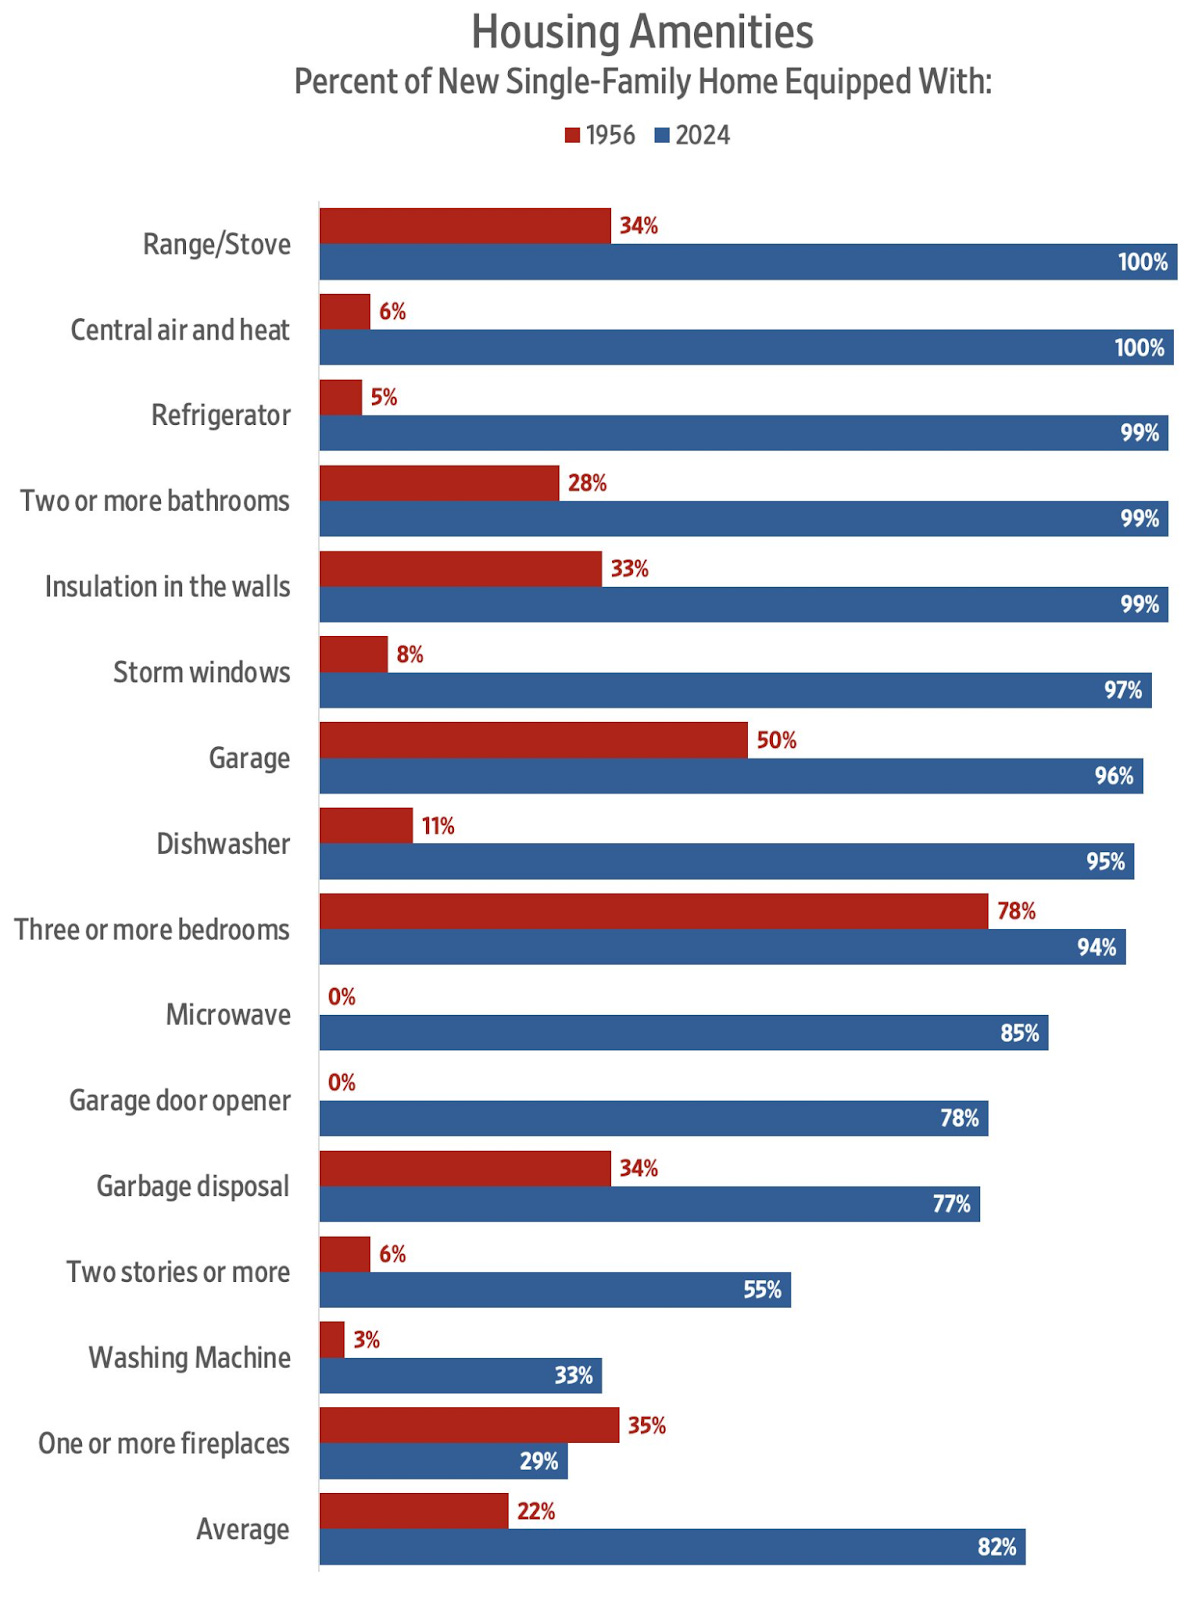
This particular distortion is relatively easily corrected by multiplying the number of homes produced by average home size, to get “square feet of home produced per employee”. As we’ve noted, several studies of construction productivity use this metric. But increasing size isn’t the only way that homes change over time. For one, modern homes are built to stricter building code standards than older homes; they will have greater fire resistance, greater ability to withstand high winds and earthquakes, and greater energy efficiency. For another, modern homes have more amenities and services in them: they’re more likely to have air conditioners, dishwashers, insulation, generally will have more bathrooms, and so on. Thus, a square foot of home built today should be considered as more output than a square foot of home built in 1960.
It can also be challenging to accurately measure inputs to the construction process. Labor is the construction input most often tracked, but this can be subject to its own “input mix” problems — namely, ensuring whether labor hours are all actually being devoted to the outputs being considered. As with changes in the output mix, if there’s a shift in how construction workers are spending their time, this could show up as a change in construction productivity that’s not actually occurring.
For instance, we’ve noted that both D’Amico et al (2023) and Goolsbee and Syverson (2025) include productivity metrics which track the amount of housing produced per residential construction employee. However, workers in residential construction don’t merely build new houses, they also renovate old houses. And there has been a gradual trend upward in spending on residential renovations. Renovations now represent 40-45% of spending on residential construction, up from 20-25% in 1970. Thus some of the measured change in “housing per employee” is likely an artifact of employees increasingly working on renovations. (Goolsbee and Syverson’s housing-per-employee metric likely doesn’t have this problem for post-1990 data, as after that BLS employment data breaks down residential remodeling employment separately).
More generally, if labor isn’t properly accounted for, that will obviously distort any productivity measures. It’s notable that for some of the sub-sector productivity measures produced by the Bureau of Labor Statistics, labor hours worked appears to be much more uniform than changes in output. For industrial buildings, there are several spikes in output (2009, 2015, and 2024) during which labor input stays flat, resulting in productivity spikes. It’s possible these are real (though it seems unlikely that firms suddenly got 50% more productive, then 50% less productive, over just a few years), but it’s also possible these are fictional, at least partially the result of labor inputs not being properly accounted for. Notably, single-family home construction does show labor inputs rising and falling in concert with output, and shows productivity as much flatter over time.
Another problem regarding labor is that many measures of construction specifically measure labor productivity — output per labor hour, or per employee — rather than total factor productivity (output per total amount of inputs). This is a problem because it’s often possible to automate or mechanize construction work — replace labor with capital — in ways that aren’t efficiency-enhancing. Construction automation and mechanization often requires a large amount of equipment to duplicate what’s possible with a relatively small amount of labor. (When I worked at the modular construction startup Katerra, the executives would often complain how hard it was for Katerra, with its expensive factories, to compete with “Bubba and his truck”: low-overhead contractors who used little more than power tools and manual labor.) Thus labor productivity could improve even as overall productivity declined.
A problem related to changes in the output mix is that construction output is often measured in dollars spent. Spending in dollars must be adjusted to account for the fact that the value of a dollar changes over time. This is typically done using what’s known as a deflator, some measure of price changes over time that can be used to convert spending in dollars to a consistent measure of construction output. The Consumer Price Index (CPI), which measures price inflation for a basket of consumer goods over time, is an example of a deflator.
There are several challenges with using deflators. One is simply choosing one that accurately captures price changes relevant to construction. Construction uses certain sorts of inputs whose price changes may not be adequately captured by commonly-used deflators. A spike in the price of building materials (such as was observed during the Covid-19 pandemic) might dramatically raise the costs of construction much more than the CPI rises.
For example, consider a building that requires $100,000 worth of materials, and gets sold for a threefold markup at $300,000. Now an identical building is being planned, but building material prices double, raising the input price to $200,000 and the output price is now $600,000. However, the Consumer Price Index only increases by 10%. Deflating output by the cost of building materials would show identical output for the first and second buildings — the price of the final building doubled, but so did the cost of the input materials. But deflating by the consumer price index, which only rose 10% between the first and second buildings, would now make it appear that the second building was worth much more output than the identical first building.
In practice, this sort of disconnect between construction input prices and other measures of inflation appears rare — in Teicholz’s 2013 article, there was little difference in productivity trends using construction-specific deflators and the more general Consumer Price Index. A more difficult problem with deflators is that a deflator can mask any gains (or losses) in productivity. Ideally we would have a deflator that measured changes in the prices of a finished building — a so-called “output deflator”, which measures the price changes of final goods and services. The Consumer Price Index is an example of an output deflator. However, many construction deflators are “input deflators”, which track changes in the price of various construction inputs — materials, labor, and so on. Using an input deflator can mask changes in productivity, because actual output is not being properly accounted for.
For instance, assume we have a building that requires $100,000 worth of materials, and 1000 hours of labor to build. We sell this building for $300,000. Now suppose that building material prices stay flat, but we figure out a way to build an essentially identical building for $75,000 worth of materials and 750 hours worth of labor, which we sell for $225,000.
In this example, productivity has improved markedly — we’ve gotten an effectively identical building for 75% of the material and 75% of the labor required previously. However, if we used an input deflator, we’d get no measured change in productivity. Output is measured in dollars for both buildings — $300,000 for the first, $225,000 for the second — and the value of the deflator stays the same since input prices haven’t changed. So using an input deflator would make it look like we’re using 75% of the material and labor inputs to get 75% of the output. Conversely, if we got less productive — if it now took $125,000 worth of materials and 1250 hours of labor to build an effectively identical building which we sold for $375,000 — that would also look like productivity being flat, getting 25% more building by using 25% more materials and labor, rather than the decline that it is.
It’s thus important to have some deflator that can capture changes in the actual value of buildings, not merely the prices of their inputs. However, figuring out how much a given amount of construction should be valued is difficult: it’s susceptible both to the output mix problem (a sector-wide deflator needs to account for the fact that the mix of buildings may be changing), and the changing quality problem (your deflator needs to somehow capture the fact that a 1000 square foot house today is “more house” than a 1000 square foot house built in 1975 due to code improvements, more amenities, and so on).
Thus “what deflator to use?” is a perennial problem when analyzing trends in construction productivity. In his 2013 article on construction productivity, Teicholz went so far as to use seven different deflators to analyze construction productivity trends. Goolsbee and Syverson (2025) noted that much of their apparent measured decline of construction productivity was a product of the construction deflator used by the BEA, which showed a much higher rate of increase in construction prices than other deflators: since output is dollars spent divided by the deflator, this would register as a decline in construction output, and thus a decline in productivity, compared to deflators which showed a lower increase in price. Garcia and Molloy (2025) note that the Census Single Family Price Index, a commonly used deflator for single-family home construction, does not fully capture changes in home quality over time: the quality adjustments include things like increases in square footage and changes in HVAC systems, but not things like improved energy efficiency or interior finish quality. Garcia and Molloy estimate that improperly accounted for quality changes result in underestimating single-family construction productivity improvements by up to 0.8% per year.
More generally, the accounting required for accurate sector or sub-sector construction productivity estimates is very difficult. We can see this by looking at changes in KLEMS data over time. New KLEMS releases don’t merely extend the time series for existing data, but they revise and update past data. These revisions can substantially alter productivity trends. Between 2019 and 2024, revisions to the UK KLEMS data resulted in a swing from showing positive construction productivity growth between 1996 and 2016 to those same years showing negative productivity growth. Swedish data revisions showed the opposite, going from negative productivity growth using 2019 data to flat productivity growth using 2024 data.
Task-level metrics of construction productivity are immune to many construction productivity measurement problems. Because we typically have a direct measure of output (materials installed per hour, etc.), we don’t face the problem of converting an output measured in dollars, or of output mix problems that stem from combining different types of outputs into one measure. But task-level metrics have their own challenges. For one, we face the problem of how to go from task-level productivity estimates to estimates of whole building, subsector, or sector productivity. For instance, task-level productivity may be improving on average (as per Goodrum et al. 2002 and 2009), but perhaps the productivity-improving tasks are less commonly used, and the more commonly used ones are showing less growth. It seems notable that for Craftsman’s full-house estimates, only one category of task — insulation installation — improved in productivity from 1993 to 2025.
Another difficulty of task-level measures of productivity is that they’re almost universally based on estimating guide data, rather than data from actual buildings produced. But this is a relatively minor weakness, as there’s good reasons to think that estimating guide data is reasonably accurate: empirically, it’s valuable enough for construction businesses to continue to pay for it over many decades, and estimating guide data seems to largely track data from other sources. Potter and Syverson (2025) noted that RS Means estimates of city-level construction costs largely agreed with construction cost survey data, and Craftman’s task-based estimates for single-family home construction cost aligns with the average price per square foot of new home construction from the US Census.
Overall, it’s hard to be confident of any single metric of construction productivity, due to the numerous, difficult-to-resolve measurement issues at work. Examinations of construction productivity will thus often use multiple metrics. Goolsbee and Syverson (2025) consider several different productivity metrics, and Teicholz (2013) uses several different deflators to try to avoid distortions from any outlier deflators.
Conclusion
Tying this all together, what can we say about trends in US construction productivity?
We can look at trends in productivity — the amount of output we get for a given amount of input — at different levels, from the sector as a whole, to sub-sectors such as housing construction, to individual buildings, all the way down to individual construction tasks. Productivity metrics for the entire construction sector consistently show productivity either staying the same or declining over time, in contrast to other sectors like manufacturing and to the economy overall. We see these trends both in the US and in most large, wealthy countries.
Sub-sector productivity metrics also broadly show stagnant or declining productivity, though not universally. Project and building-level measures of productivity also generally show trends of stagnant or declining productivity, though most of this data is for home construction.
Task-level productivity trend estimates are, like sub-sector trends, somewhat mixed. Some task-level estimates show similar trends of stagnant or declining productivity over time, others show sluggish to modest growth depending on the collection of tasks and the time period considered.
All these estimates must be taken with a grain of salt, as it’s difficult to accurately measure construction inputs and outputs. Productivity estimates can be distorted by a variety of factors, including changes in the output mix, failing to properly account for construction labor inputs, and improperly deflating construction spending.
But these measurement difficulties are tempered by the fact that the estimates almost all point in the same direction. Most measures of construction productivity show at best very low levels of growth, far below what’s observed in the economy overall; many measures show declining productivity. We see some subsectors that may have seen periods of substantially increasing productivity (such as industrial building construction), and evidence that some individual construction tasks have gotten more productive for at least some periods of time, but overall the picture of stagnant productivity growth is fairly consistent.
RSMeans doesn’t give individual trade hourly rates for 1954, so for the 1954-1985 period we’ll simply use the average construction wage increase over that time.
KLEMS stands for capital (K), labor (L), energy (E), materials (M), and services (S).
To calculate productivity using this data — specifically, labor productivity, or the amount of output we get for a specific amount of labor — we can use the “chain linked gross value add” measure, VA_Q or VA_QI in the database. Gross value-add is the value of the outputs (in this case, the buildings and infrastructure produced) minus the value of “intermediate inputs” — materials, services, energy, and other things purchased from outside the sector in question. In other words, it’s the total value that the industry itself contributes. “Chain linked” is a way of adjusting for inflation, by calculating the growth rate for one year using the previous year’s prices, then “chaining” those growth rates together. To get sector productivity, we just divide chain linked gross value-add by a measure of total labor effort in that sector. For that labor effort variable, we’ll use H_EMP, which is the total number of hours worked by “engaged persons” — employees, business owners, and people who are self-employed. For a few countries, we’ll need to calculate labor productivity slightly differently. India’s KLEMS data doesn’t include H_EMP, so we’ll use the number of employees instead. China’s KLEMS data doesn’t include VA_Q, but it does include the growth rate of labor productivity by industry, which provides the same information.
The output measures are the sales price and the input measures appear to only include construction (service examples are renting machinery and architectural services). Your examples are ratios of final value to input cost, what about taxes and fees (permits, etc)? (Services in KLEMS may include such frictions - I wasnt able to find details). That would appear to make productivity worse, less house value per input if you further subtract frictions.
I've seen estimates of around 25% of total costs coming from regulations (Laurie Goodman Urban Institute), although part of that is building code changes which is in your quality control.
Two thoughts... first, unless one is looking at modular or manufactured homes/buildings, it is difficult to see where automation and computerization can be applied in construction, unlike high volume manufacturing or services such as finance/accounting, engineering, legal, etc. It is much like teaching or haircutting; there are practical limits on productivity increases. Similarly, aside from plumbing which transitioned from iron pipe with threaded or lead/okum joints to soldered copper and finally pex and PVC, most tasks are similar now to those in the 60s (I'm surprised the measures don't reflect this). Pneumatic and battery tools helped, but not significantly.
Secondly, how does the quality and education of the construction workforce affect productivity? As someone that had experience with construction trades in the past 50 years, the basic skills such as literacy, math and simply pride of workmanship has declined. Immigrant labor has benefits, but formal vocational training and unionization also have benefits.