

How Does the US Use Water?
Water infrastructure often gets less attention and focus than other types of infrastructure. Both the Federal Highway Administration and the Department of Energy have annual budgets around $46 billion dollars. The Department of Housing and Urban Development has an annual budget of $60 billion. The closest thing the federal government has to a department of water infrastructure, the Bureau of Reclamation, has an annual budget of just $1.1 billion. Water in the US is generally both widely available and inexpensive: my monthly water bill is roughly 5% of the cost of my monthly electricity bill, and the service is far more reliable. And unlike, say, energy, water isn’t the locus of exciting technological change or great power competition.
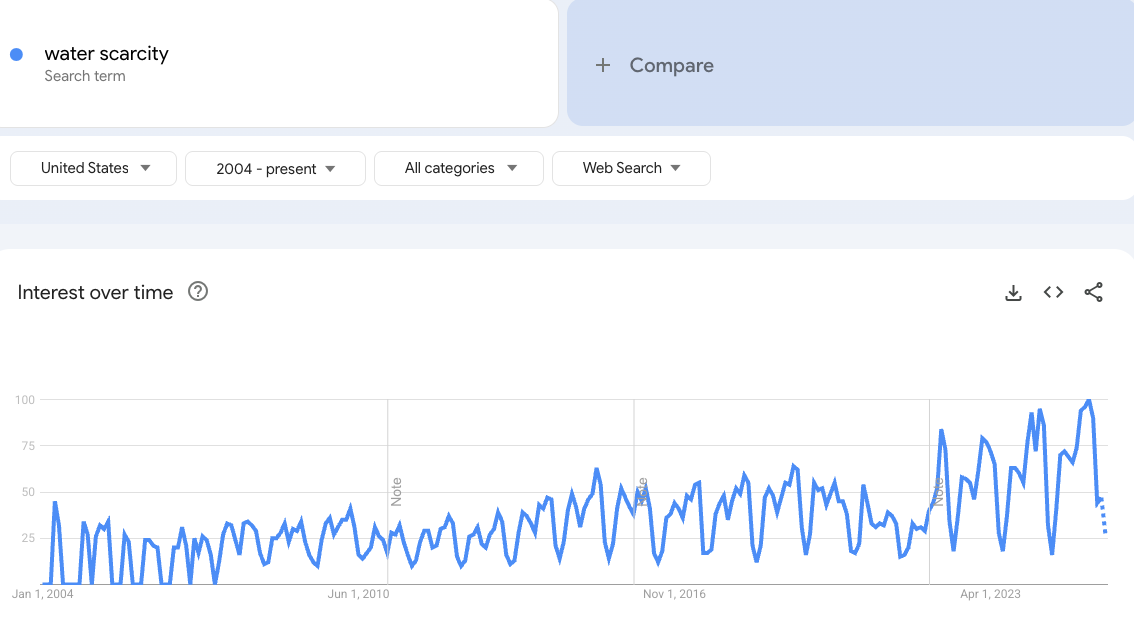
But this might be changing. Rising demand for water in the arid southwest (which has experienced decades of drought) is creating increasing concern about water availability. Vast amounts of investment is being poured into data center construction, and while data centers are most notable for consuming large amounts of power, they’re also heavy users of water: a large data center can use millions of gallons of water a day for cooling. Google search interest for “water scarcity” has gradually risen over the last two decades.
Because water is such a critical resource, needed for everything from agriculture to manufacturing to artificial intelligence to sustaining basic human life, it's worth understanding how we use water, and how that use has changed over time.
Overview of US water use
Most of us probably remember learning about the water cycle in school. Water falls to the earth via precipitation — rain, snow, sleet — and flows into rivers, lakes, streams, and water-bearing geological strata called aquifers. From there, water continues to move: it goes back into the atmosphere via evapotranspiration, moves from streams and rivers into aquifers (and vice versa), and flows out into the ocean.1
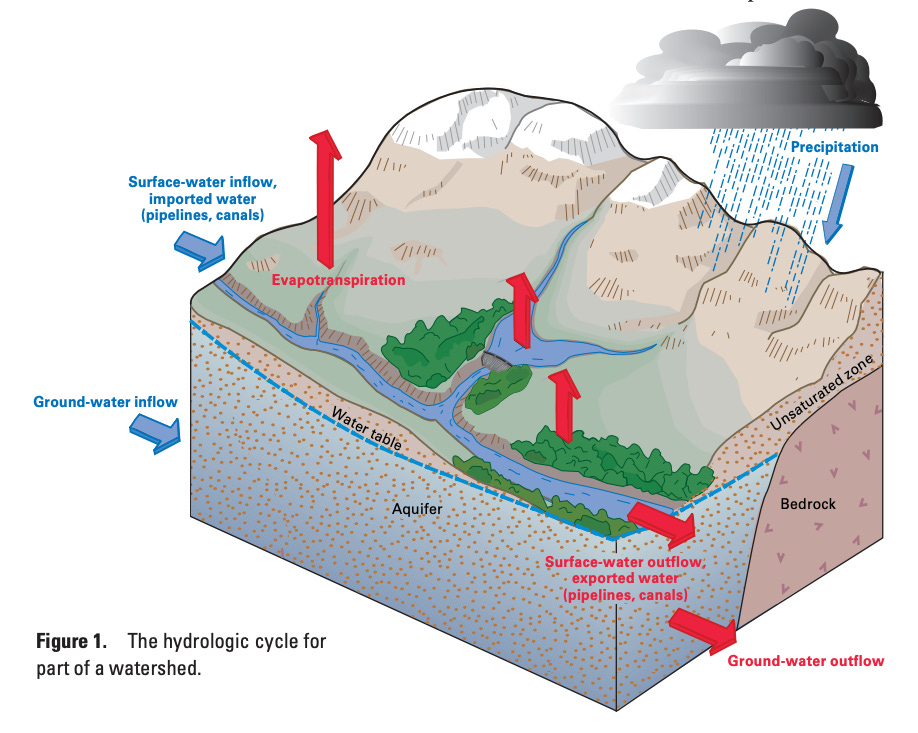
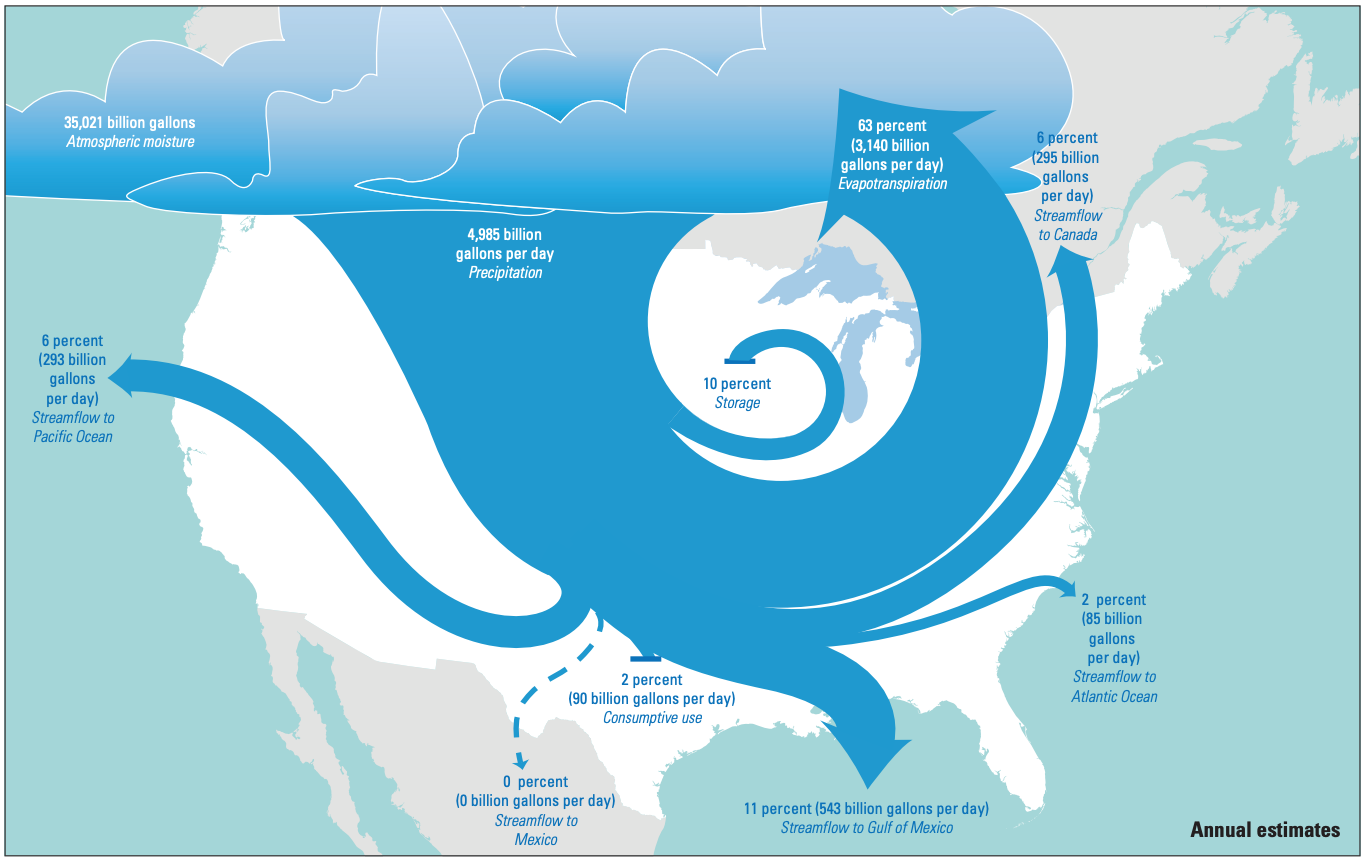
Altogether, the US receives about 5 trillion gallons of precipitation a day. Most of that (63%) gets returned to the atmosphere via evapotranspiration. Much of the rest ultimately flows into the Gulf of Mexico (11%), Pacific Ocean (6%), and Atlantic Ocean (2%). About 10% gets stored in surface bodies of water (lakes, reservoirs) or underground aquifers, and 6% flows back into Canada. The remaining 2% is consumed by people in various ways.
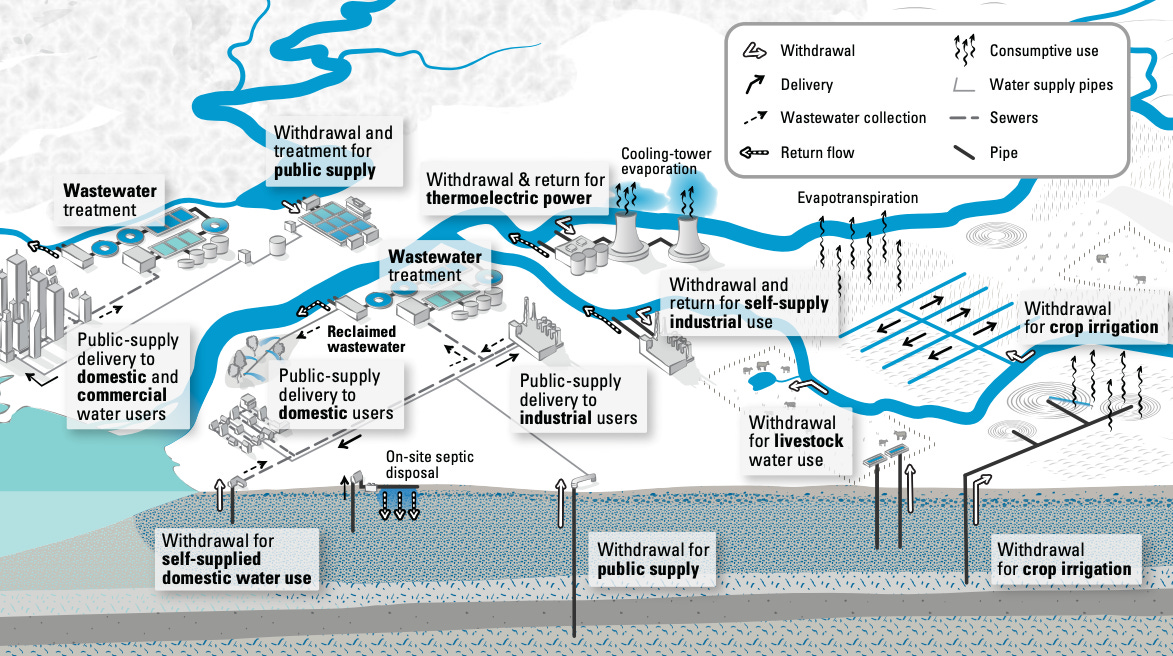
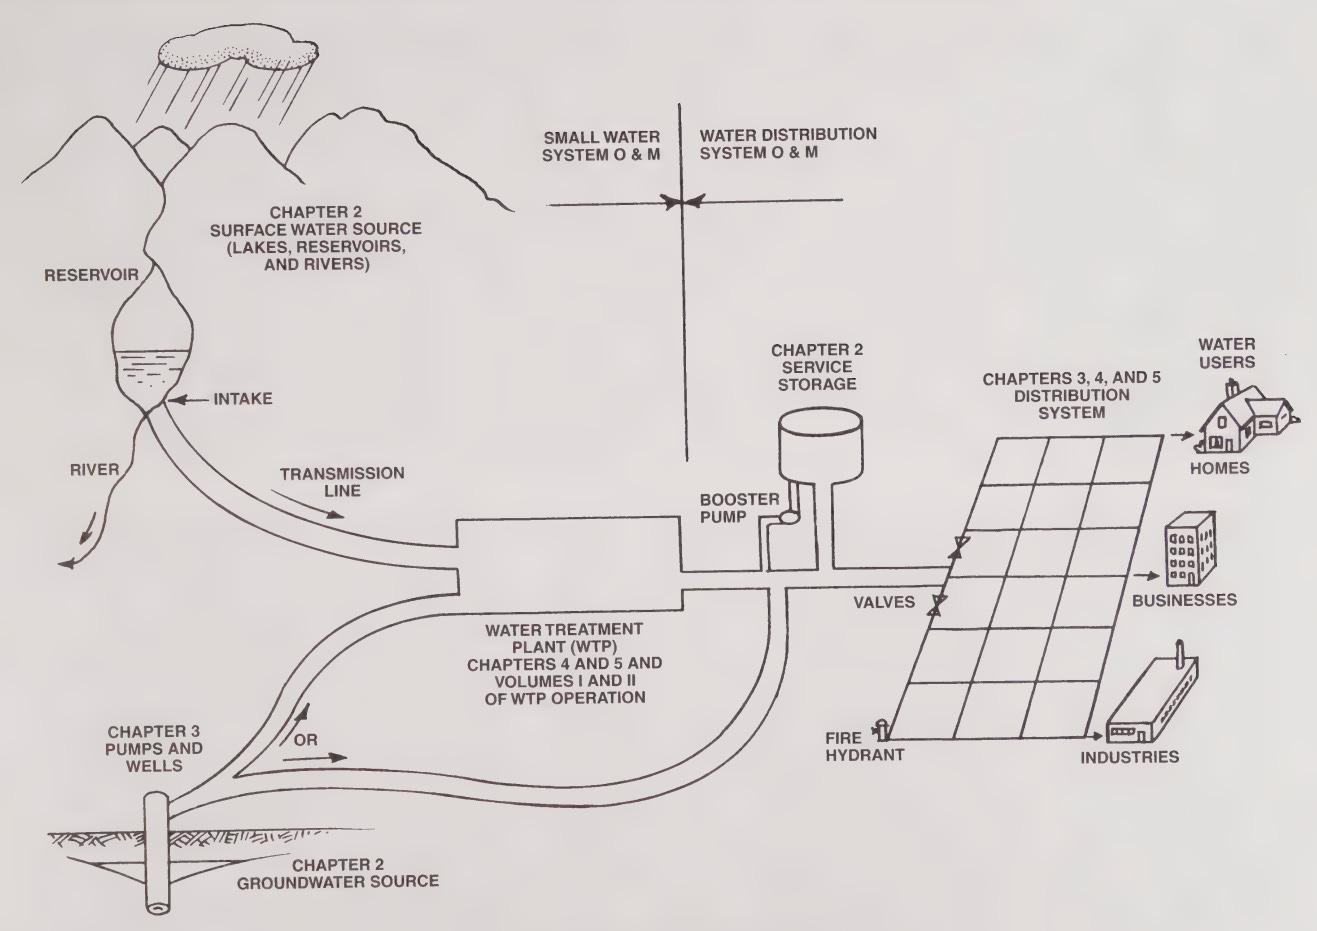
We use water by tapping these various stores and flows. At a high level, water infrastructure resembles electricity infrastructure. In both cases, you have large sources of supply (power plants for electricity and lakes/rivers/underground aquifers for water), which gets transported by a high-capacity transmission system. With electricity transmission is done by high-voltage power lines which connect power plants to substations; with water it's done by large-diameter pipes which connect sources to treatment plants or water storage facilities. From there, as with electricity, water is moved by a distribution system, smaller-capacity pipes and pumps that bring water to individual homes and businesses. And as with electricity, very large consumers of water (along with some smaller consumers) might tap various sources of water directly rather than get their supply via a utility company.
Water use by category
As of 2015, the year of the most recent USGS report on US water consumption, the US used about 322 billion gallons of water each day, or 117 trillion gallons each year. 87% of this is freshwater, and the rest is saltwater, either from the ocean or from brackish coastal water like estuaries. 74% of all US water use is from surface sources like lakes and rivers, and 26% is from underground aquifers.
An important distinction when understanding water use is “consumptive” vs “non-consumptive” uses. Consumptive water use is when the water is consumed as part of the process: either it gets incorporated into whatever is being produced, evaporates back into the atmosphere, or is otherwise no longer available in fluid form. Non-consumptive water use is when the water is still available to use in fluid form after the process is completed, though perhaps at a higher temperature, or with some additional pollutants or impurities. The graph below shows total water use by category, broken out into consumptive and non-consumptive uses:
As of 2015, the largest user of water in the US is actually thermoelectric power plants — plants that use heat to produce steam to drive a turbine. Water is used in these plants to condense steam back to liquid water so that it can be heated again and routed back through the turbine. Thermoelectric power plants make up 41% of total water use in the US. However, nearly all this (around 97%) use is non-consumptive. Historically thermoelectric power plants were built using “once-through” cooling systems: water would be drawn from some source, run through the cooling system, and then dumped back out into the same source at a slightly raised temperature. This water can be either fresh water or saltwater, and around 97% of the saltwater used in the US each year is used to cool coastal power plants.
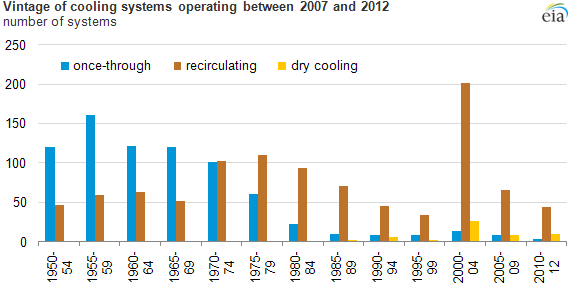
Since the 1970s, most thermoelectric power plants have been built with recirculating cooling systems rather than once-through cooling systems. This is due to things like the Clean Water Act, which set limits on thermal discharge from power plants and made once-through cooling systems less attractive. Recirculating systems circulate the same water over and over again through the system. These systems use much less water overall, but a much greater fraction of the water they do use is consumed (it's lost to evaporation, typically via large cooling towers). As of 2012 about 43% of thermal power plants used once-through cooling, but once-through cooling systems make up around 96% of all water used by thermoelectric power plants.
After power plants, the next largest use of water in the US is for irrigation: watering plants and crops. Altogether, irrigation makes up 37% of total US water use. Unlike thermoelectric power plants, most of this water (just over 60%) is consumptive use. What’s more, even the irrigation water that isn’t consumed may not be readily reused. While thermoelectric plants which typically dump their water back into the same river, lake, or ocean it was drawn from, much of the non-consumptive water used for irrigation seeps back into the ground, potentially far from where it was originally tapped. Depending on how water flows through the ground in a particular location, it could be centuries or even longer before that water reaches somewhere it can be easily retrieved.
Most water for irrigation is used for crops, though it’s hard to know exactly what fraction, as many states don’t break out irrigated cropland as a separate category.2 As of 2015, the US has around 63 million acres of irrigated land. This is around 20% of the US’s 337 million acres of cropland, but it’s responsible for around 54% of the value of US crops. The largest water-using crop in the US is alfalfa (around 11.1 billion gallons per day), followed by orchards (10.9 billion), corn (10.4 billion), soybeans (5.1 billion), and rice (5 billion) (though if we lump all separate categories of corn together — sweet corn, silage, etc. —, it comes in at number one).
Another user of irrigation water is golf courses. The US has around 16,000 golf courses, and collectively they use about a billion gallons of water a day, or around 0.3% of total US water use.
After irrigation, the next largest category of US water use is public utility supplied water for homes and businesses. Public water use totals to around 39 billion gallons a day, or 12% of total US water use. Most public water — 23.3 billion gallons, or around 60% — is for domestic use in homes. In addition to publicly supplied water for homes, another 3.3 billion gallons are self-supplied to homes via things like privately owned wells. An estimated 42 million people in the US use self-supplied water.
Average per-capita domestic water use in the US is 82 gallons per day. By comparison, German homes use around 33 gallons per person per day, UK homes use around 37 gallons, and French homes use around 39 gallons.
The next largest category of water use is industry, which uses about 14.8 billion gallons of water a day, or 4.5% of all US water use). Many industrial processes require large amounts of water, often either for cooling or as a way to carry and mix materials or chemicals. The chart below shows several US industries that use large amounts of water.
One of the largest water-using industries is forest products, particularly pulp and paper mills which require water for things like rinsing the pulp after it's been bleached. Forest product manufacturing in the US uses around 4 billion gallons of water a day. Other large industrial users of water are steelmaking (around 1.8 billion gallons per day), crude oil refining (around 270 million gallons a day), and semiconductor manufacturing (around 80 million gallons a day).
However, as with thermoelectric power plants, much of industrial water use is non-consumptive (though USGS doesn’t break out consumptive and non-consumptive separately for industrial use). In forest products, most of the water is returned to the source after it goes through the process, and only around 12% of the water used is consumptive. Similarly, only around 10% of the water used for steel production is consumed.
Because of rising concern about water use of data centers, it's worth looking at them specifically. Per Lawrence Berkeley Lab, in 2023, data centers used around 48 million gallons of water a day directly for cooling. Most of this water will evaporate as part of the cooling process, and is thus consumed. If you include indirect water use by including their share of water required for electricity consumption, this adds another 580 million gallons per day. However, as we’ve noted, most thermoelectric power plant water use is not consumptive. Taking this into account, actual water consumed by data centers is around 66 million gallons per day. By 2028, that’s estimated to rise by two to four times.
This is a large amount of water when compared to the amount of water homes use, but it's not particularly large when compared to other large-scale industrial uses. 66 million gallons per day is about 6% of the water used by US golf courses, and it's about 3% of the water used to grow cotton in 2023.
(Update: These values of data center water consumption are incorrect. See my follow up post here.)
We can also think about it in economic terms. The 2.5 billion gallons per day required to grow cotton in the US created about six billion pounds of cotton in 2023, worth around $4.5 billion. Data centers, by contrast, are critical infrastructure for technology companies worth many trillions of dollars. Anthropic alone, just one of many AI companies, is already making $5 billion dollars every year selling access to its AI model. A gallon of water used to cool a data center is creating thousands of times more value than if that gallon were used to water a cotton plant.
The remaining users of water in the US are aquaculture (fish farms) at 7.5 billion gallons a day (2.3% of all water use), mining at 4 billion gallons a day (1.2%), and water for livestock at 2 billion gallons a day (0.6%).
Water use by geography
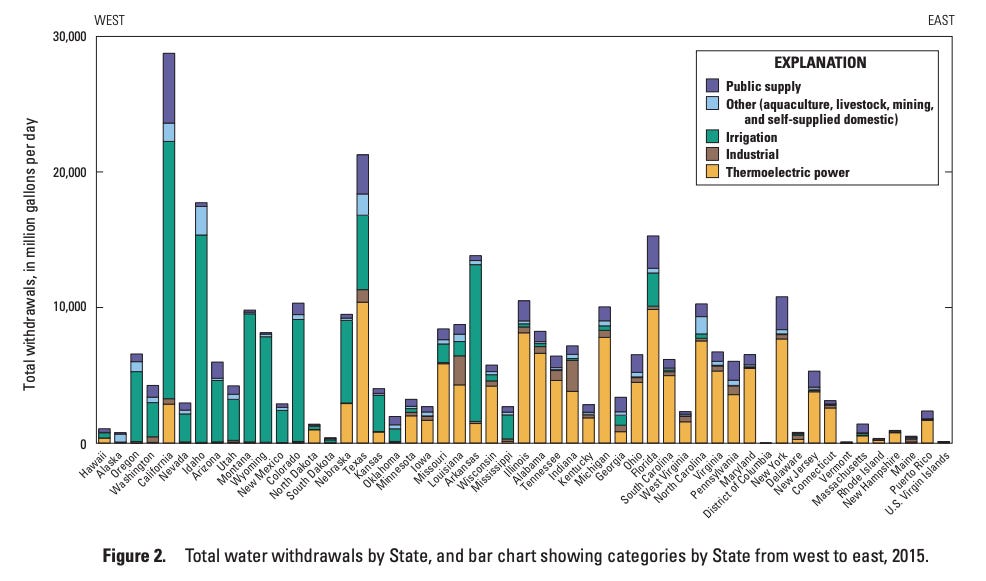
How does US water use vary by geography? The map below shows total water consumption by state:
California is the number one water consumer at 28.8 billion gallons per day, followed by Texas (21.3 billion), Idaho (17.7 billion), Florida (15.3 billion) and Arkansas (13.8). The large consumers of water are states that either have a lot of irrigated land (California, Idaho, Arkansas), have a lot of thermal power plant cooling (Florida), or both (Texas).
Because this lumps in such disparate uses of water, it's more illuminating to break this down by category. The map below shows water used for irrigation by state.
And this map shows a more granular view of where, specifically, irrigated acres are located.
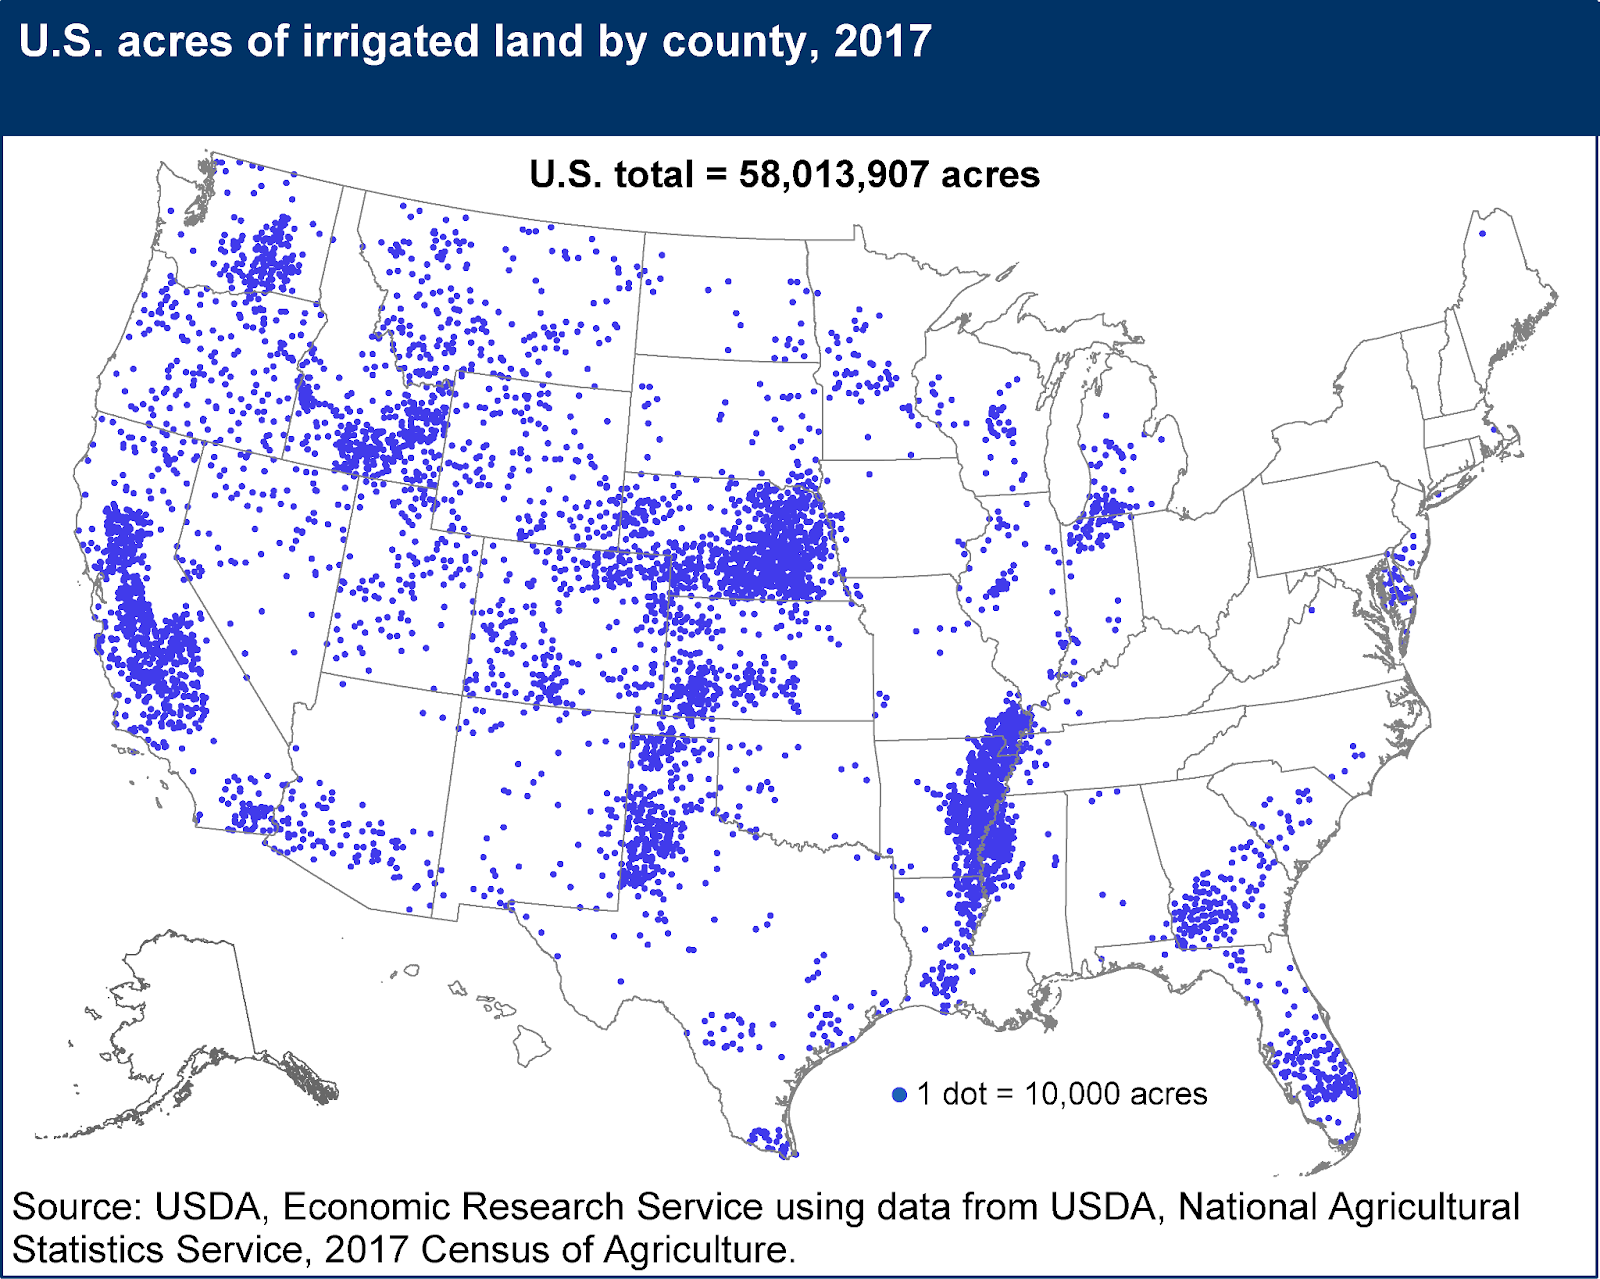
Most irrigated acres are in the western half of the US. This isn’t that surprising, as western states get far less precipitation than eastern states. The map below shows average yearly precipitation by state (averaged between the years 1971 and 2000).
Average annual rainfall is around 45.6 inches per year in the eastern half of the US, compared to 21 inches per year in the western half.
The amount of water an individual state has available for productive use is not simply a portion of all the precipitation it receives (due to movement of water through rivers, streams and aquifers), but it's nevertheless interesting to see irrigation water use as a fraction of a state’s total precipitation.
In most states, irrigation water is equivalent to a tiny fraction of total precipitation: in 30 states it's less than 1%. But in some western states it's much higher. In Idaho water used for irrigation is equivalent to more than 20% of all the precipitation the state receives.
Outside of the western states, the major user of irrigation water is Arkansas. Apparently this is due to the large amount of rice cultivated there (nearly half of all rice produced in the US), which requires a very large amount of water to produce.
Much of the water used for irrigation — roughly half — is pumped from underground aquifers. In many places in the US, groundwater is being pumped out faster than it recharges from precipitation, leading to gradual depletion of the aquifer.
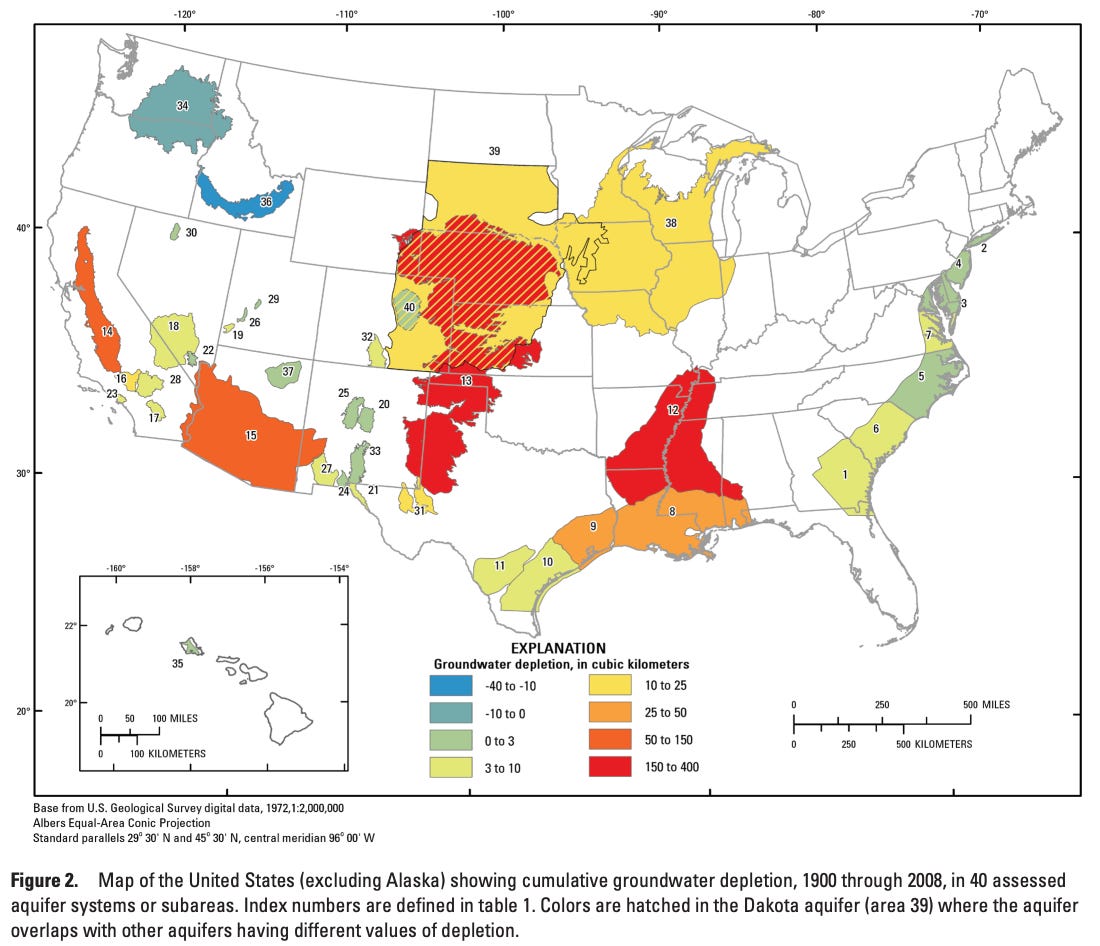
(Interestingly, this map shows groundwater recharging in an Idaho aquifer, despite Idaho being such a large user of irrigation water. Possibly this is explained by the time period difference, as this map only goes to 2008.)
Other than irrigation, the largest category of water use in the US is cooling at thermoelectric power plants. Here’s water used by thermoelectric power plants, by state and by county.
Most water used for powerplant cooling is in the eastern half of the country (as well as Texas), as that’s where most power plants are.
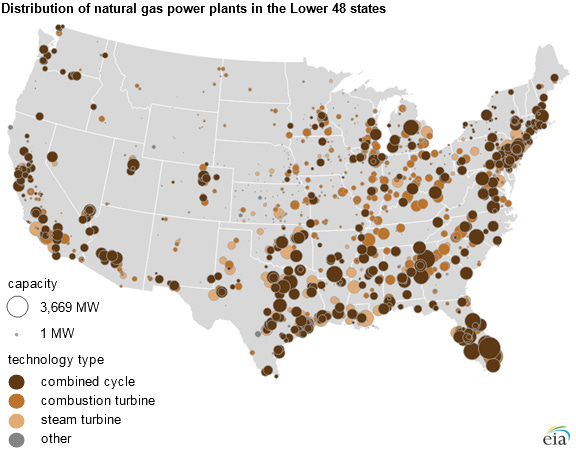
Via EIA.
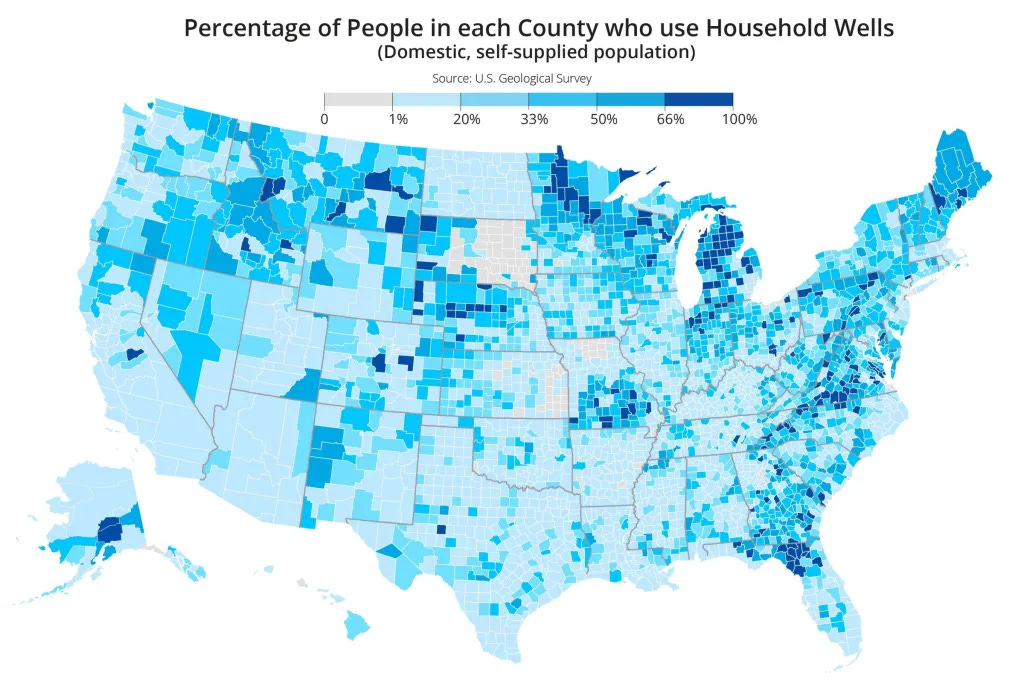
The next largest category of water use is public water consumption. Because public water mostly consists of water used in homes, I’ve also included self-supplied water used by homes. The maps below show public and self-supplied water use by state.
Because public and self-supplied water use is a function of population, this map is basically a population map. So let’s also look at public and self-supplied water use per capita.
There’s less variation here than I expected. The highest consuming states (Utah, Idaho) use only about two times the amount of water per capita as the lowest consuming states.
If we look at self-supplied water use specifically, we can see that it's highly regionally concentrated. In some areas of the country, self-supplied water makes up nearly all domestic water use, while in other areas of the country it's much less common.
The next largest category of water use is industrial. The map below shows industrial water use by county:
Industrial water consumption is concentrated in a very small number of locations: northern Indiana for steel production, Louisiana and the Gulf Coast for oil refining, and so on. 100 of the US’s 3200 counties are responsible for more than 70% of the US’s industrial water consumption, and 23% of US industrial water use is concentrated in just five counties.
Water use over time
How have patterns of water consumption changed over time? Overall water use peaked in 1980, and has trended downward since then.
Thermoelectric power use is down more than 37% from its peak, irrigation use is down 21%, industrial is down at least 43% (and probably more), and public plus self supplied domestic water use is down 12% in absolute terms and 22% in per-capita terms.3
Another trend from the 1950s through the 1970s was increased use of groundwater. Between 1950 and 1980 the annual volume of groundwater used in the US more than doubled, from 34 billion gallons per day to 83 billion gallons per day. Since then, groundwater use has been roughly constant (as of 2015, it’s at 82.3 billion gallons per day), even as surface water use has declined by nearly 30%. Groundwater is thus making up an increasingly large fraction of overall water use.
Conclusion
My overall takeaway is that you need to be careful when talking about water use: it’s very easy to take figures out of context, or make misleading comparisons. Very often I see alarmist discussions about water use that don’t take into account the distinction between consumptive and non-consumptive uses. Billions of gallons of water a day are “used” by thermal power plants, but the water is quickly returned to where it came from, so this use isn’t reducing the supply of available fresh water in any meaningful sense. Similarly, the millions of gallons of water a day a large data center can use sounds like a lot when compared to the hundreds of gallons a typical home uses, but compared to other large-scale industrial or agricultural uses of water, it's a mere drop in the bucket.
On the other hand, it’s also easy to go too far in the other direction. People sometimes invoke the idea that water moves through a cycle and never really gets destroyed, in order to suggest that we don’t need to be concerned at all about water use. But while water may not get destroyed, it can get “used up” in the sense that it becomes infeasible or uneconomic to access it. If we draw down aquifers that have spent hundreds or thousands of years accumulating water, the water isn’t “gone” in the sense that it's been chemically transformed back into hydrogen and oxygen, but much of it probably ends up in the atmosphere, the ocean, or other places not readily or cheaply retrievable. Outside of large-scale desalination of ocean water, we’re ultimately limited in how much fresh water we can use by the amount of precipitation we get, and while we currently use a very small fraction of total precipitation (around 6%), it’s not as if there’s no limit to how much naturally-produced fresh water is available.
Evapotranspiration is the combination of evaporation and transpiration (water evaporating from plants).
There’s something of a data inconsistency here. If you look only at states that give data for irrigated cropland specifically, it suggests that 95% or more of irrigation water is used for crops. However, overall irrigation water is on the order of 118 billion gallons of water a day, but sources like the USDA suggest that irrigated cropland is only around 70-75 billion gallons a day, leaving around 40% of irrigation water unaccounted for. It’s not clear to me whether irrigation water use is around 95% (and USDA is undercounting or USGS is overcounting), or if it's closer to 60% and there’s some other huge user of irrigation water.
It’s hard to be sure about industrial since prior to 1980 it was lumped in with mining.
Excellent article. I would also like to point out what a very small percentage of total water use is for households. When people think of water conservation, they typically think of low-flow showers and low-water-use dishwashers. Household appliances actually do not use that much water as a percentage, and by far the biggest use within households is home lawns and gardens. So if you want to encourage water conservation, focus on agriculture and the other large water users mentioned in this article.
Excellent read.