How Fast Can a City Grow?
In the last post, we noted Los Angeles was the fastest-growing city in the US at the end of the 19th century, growing nearly 10% yearly between 1880 and 1930.
This made me wonder what the landscape of city growth rates looks like. How fast were other US cities growing at the same time, or before and after that? How does a 10% annual growth rate compare to other fast-growing cities around the world? How fast is it possible for a city to grow?
Answering these questions turns out to be more complicated than it seems. For one, though on average cities of different sizes tend to grow at the same rate, a smaller city has the potential to grow much faster than a larger city. When gold was discovered in California in 1848, the population of San Francisco increased from 1,000 to 25,000 in a single year, an annual growth rate of 2,400%. If New York had grown at the same rate that year, it would have reached a population of more than 17 million, nearly 75% of the contemporary population of the US.
And if we look at average growth rate over time, very high growth rates when cities are small can also mask much lower growth rates when cities are larger. If we take a broader view, the enormous 1-year growth rate of San Francisco in 1848 gives it an average annual growth rate of over 9% between 1848 and 1920. But if we just look at the period between 1880 and 1920, we see a much more modest 2% annual growth rate.
One way to deal with this is to look at city growth rates as a function of population. This lets us see how growth rate changes as a city gets larger, and lets us do an apples to apples comparison of different cities which may have grown at different times.
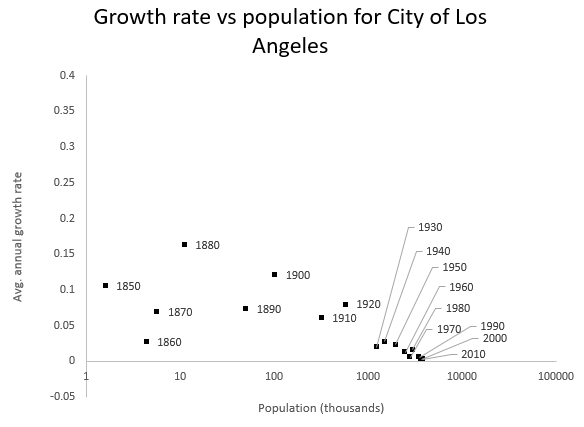
Here, for instance, is the growth rate of the city of Los Angeles over time. Each point represents the growth rate of the city at a given level of population:
As Los Angeles grows larger, its growth rate falls (though not monotonically). In its early years, Los Angeles had several decades of 10+% annual growth (rising above 15% annual growth in the 1880s). But since surpassing 1 million people, its growth has been much more modest, never rising above 5% annually.
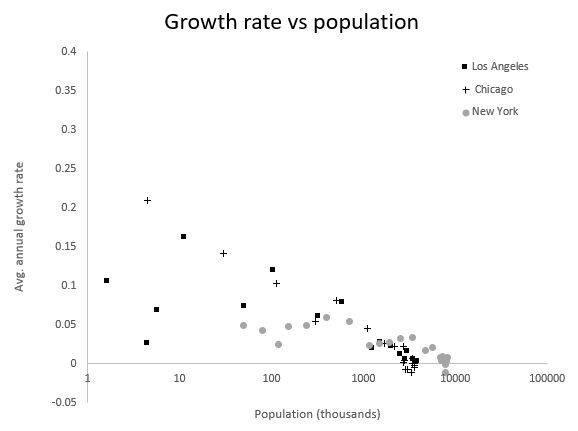
How does this compare with the growth of other large US cities? Here are Los Angeles' growth rates compared with New York and Chicago’s.
Chicago and Los Angeles show a fairly similar growth pattern, with growth rates well above 10% annually when they were small and steadily falling to just a few percent a year as they grew larger (with Chicago having several decades of negative growth). New York, by contrast, never had such rapid growth rates. Even at fewer than 100,000 people, it never grew faster than 6% a year. New York’s growth rate, however, declined less than Los Angeles or Chicago as the city grew larger. At around 3.5 million people, New York was still growing at over 3% per year, compared to less than 1% for LA and Chicago. This may not sound like much, but it's the difference between doubling in size every 23 years vs. every 70 years.
How do these growth rates compare to other US cities?
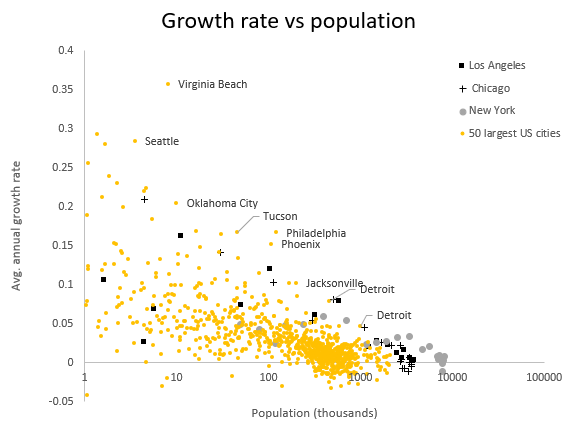
Here's growth rate vs. city size for the 50 largest cities in the US (note that these values are for the city, not the metro area).
Several cities with fewer than 100,000 people have faster growth rates than Los Angeles and Chicago, such as Philadelphia, Phoenix, and Tucson. Some cities with roughly 10,000 or fewer people exhibit growth rates approaching 30% annually (Virginia Beach has an even higher 35% growth rate, but I think this is an exercise in boundary drawing rather than growth, as in 1963 the city merged with the county). But beyond around 100,000 people, 10% growth seems to be the highest value, and the majority of cities grow less than 5% annually. Past 500,000 people, no US city other than Los Angeles, New York and Chicago has sustained a growth rate of more than 5% (though Detroit came close).
How do these growth rates compare to other countries?
We can use the UN World Urbanization Prospects database, which has estimated population data for every city in the world above 300,000 people, going back to 1950 at 5-year intervals. The database includes more than 1,800 cities. Because it only goes back to 1950, it will obviously miss some countries' greatest periods of urbanization (such as the US), but it will let us compare the pace at which global cities grow in modern times. Note that while previous graphs have been based on city population, the UN data is based on metro area population. Also, previous growth rates were averaged over 10-year intervals (since they’re based on US Census data), whereas these are averaged over 5-year intervals.
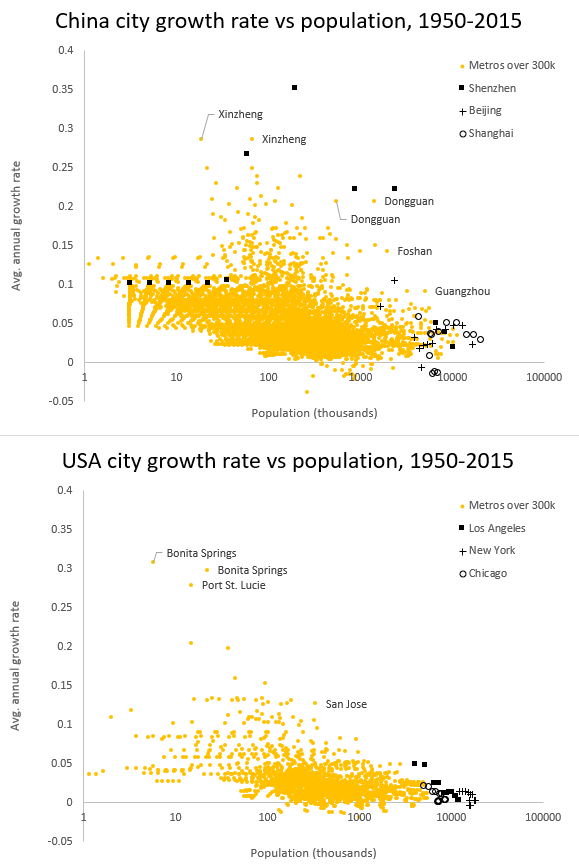
To start, here are the growth rates of Chinese and US metros between 1950 and 2015:
Despite substantial differences in measurement (different averaging periods, different time periods, different definitions of “city”), the pattern of US city growth in the UN data looks fairly similar to the Census data: a few small cities (around 10,000 people) with very high growth rates (up to 30%), a few larger cities (around 100,000-300,000) managing more than 10% annual growth, with cities larger than that growing even slower, mostly less than 5% per year. Past 1 million people, no US metro has grown more than 5% per year since 1950.
(Note that for both US and Chinese cities, we see an absence of small, slow-growing cities. This is an artifact of the dataset: since it only includes cities that have more than 300,000 people in 2018, any small, slow-growing city would not have grown enough to be included in the data.)
Unsurprisingly, since 1950, Chinese cities have mostly exhibited higher growth rates than US cities. Only around 12% of US data points are above a 5% growth rate, whereas for China this is close to 50%. China also has 2.5x the fraction of cities growing above 10% per year, and 3.3x the fraction of cities growing above 15% per year.
Chinese cities also have high growth rates at much higher population levels than US cities. No US city with more than 1 million people has had a growth rate of greater than 10%, but 5 Chinese cities have managed this. And while no US city over 100,000 people has maintained over a 15% growth rate, 25(!) Chinese cities have.
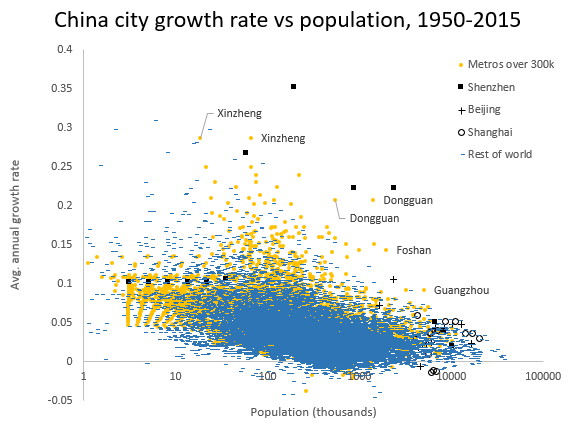
And some cities are outliers even within China. The most notable here is Shenzhen, which saw enormous growth after it became China’s first special economic zone in 1980. At a population of around 200,000, Shenzhen was growing at 35% annually, and it was still growing at over 20% annually when its population crossed 2 million. And Dongguan, a city I know nothing about but which according to Wikipedia “ranks behind only Shenzhen, Shanghai and Suzhou in exports among Chinese cities,” has also had enormous growth rates, growing at over 20% annually when its population was 1.4 million.
It's also clear from these graphs that much of the UN data is estimated. Shenzhen, for instance, shows a nearly uniform growth rate until it reaches around 35,000 people, and many other cities can be seen to have uniform early growth rates. But when we look at Census data, “real” city growth rates tend to vary much more. So we should take any conclusions from the UN data with a grain of salt.
China turns out to be an outlier in growth rates no matter which country we compare it to. Here are Chinese city growth rates, compared with every other city in the UN database.
(Note: a few cities have had growth rates at small populations high enough that they don’t show up on this chart. They are Port St. Lucie (over 100% annual growth rate at a population of 396) and Cancun (around 75% annual growth at a population of 127 and 2000).
The high-growth cities greater than 100,000 in population are overwhelmingly Chinese. Since 1950, 36 cities in the world over 100,000 people have managed to grow faster than 15% per year. 25 of these cities are Chinese.
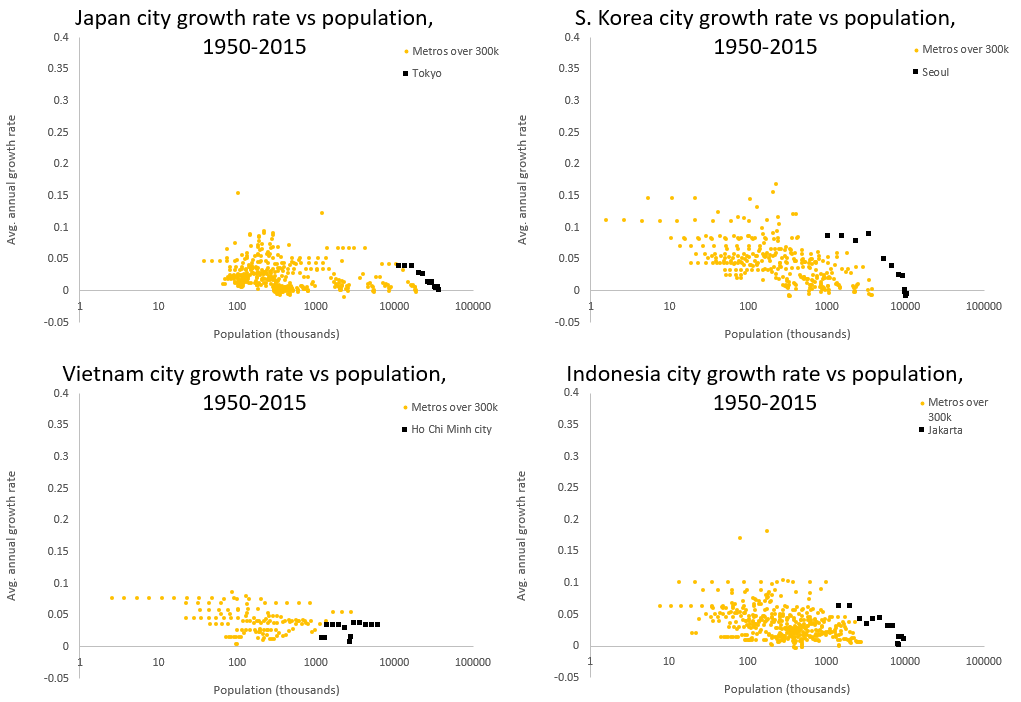
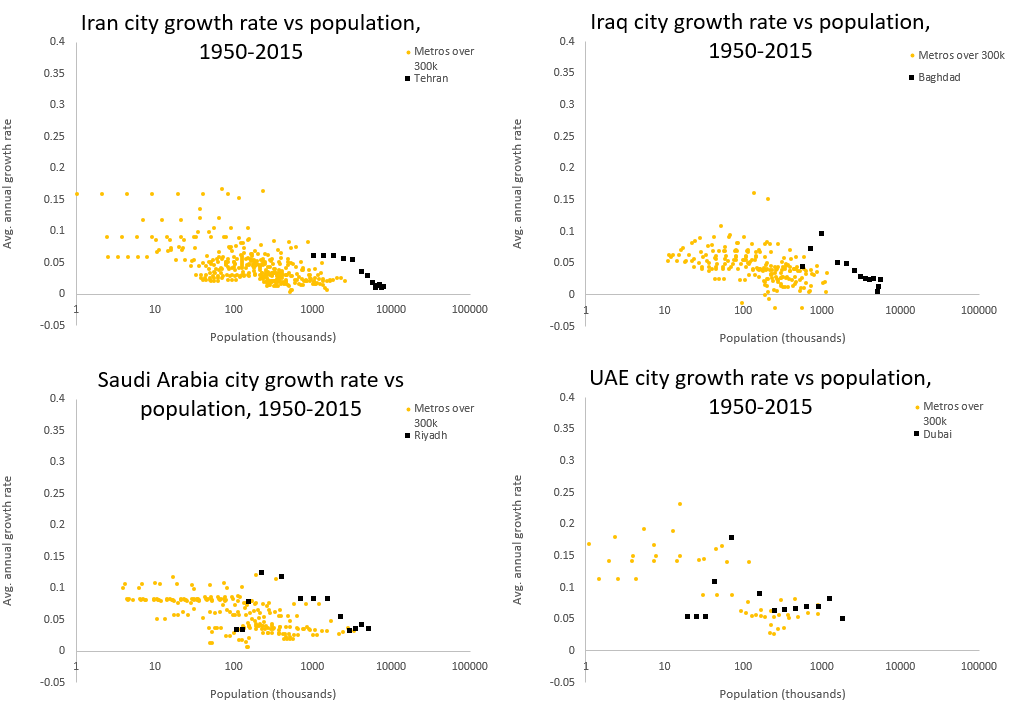
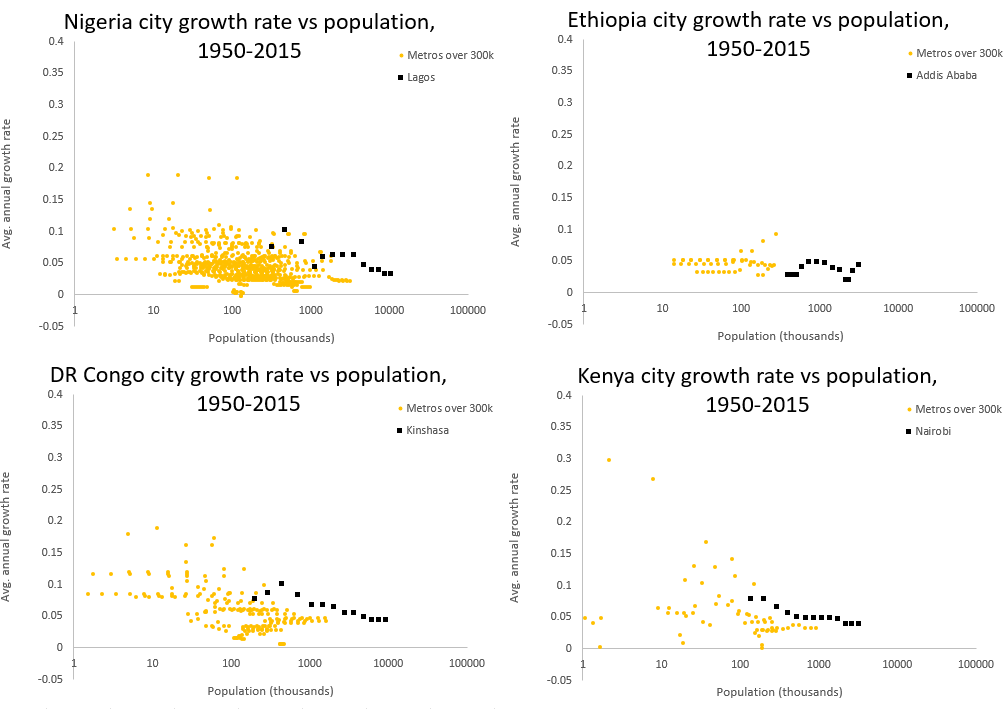
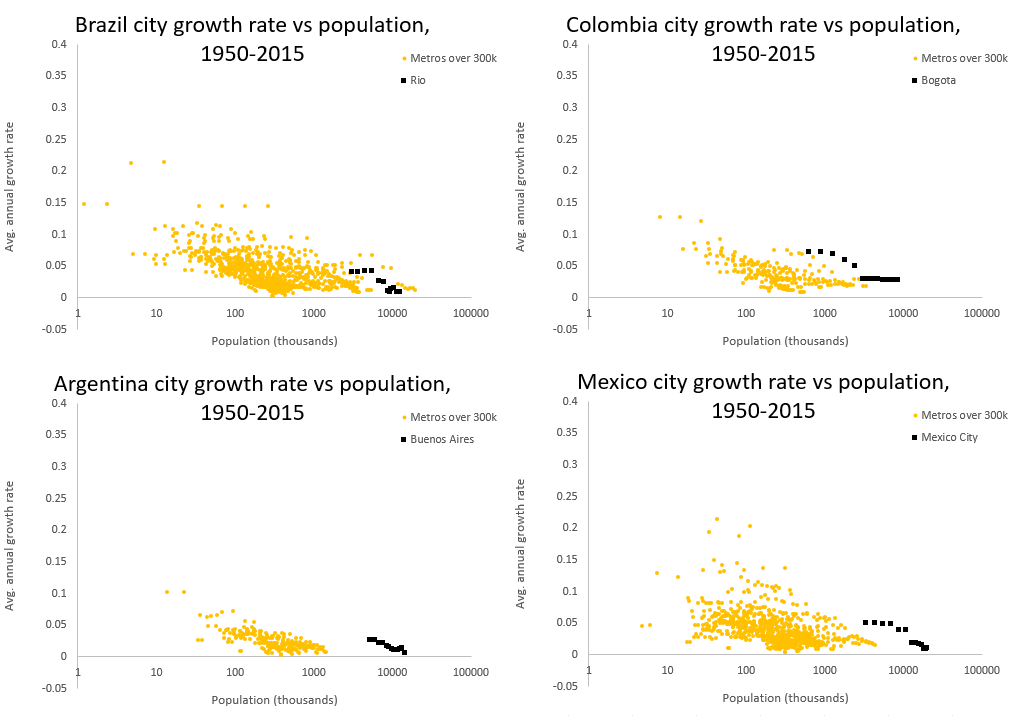
Outside of China, most countries seem to show a similar city growth pattern as the US. We see most cities growing somewhere between 0 and 5% a year, a handful of small cities growing rapidly (10-20% a year or more), a few larger cities maintaining growth rates above 10%, and growth rates below 10% for cities beyond 1 million.
In Southeast Asia, for instance, here are Japan, Vietnam, Indonesia, and South Korea (click to embiggen):
In the Middle East, here are Iran, Iraq, Saudi Arabia, and UAE:
In Africa, here are Nigeria, Kenya, Ethiopia, and Congo:
And in South and Central America, here are Brazil, Colombia, Argentina, and Mexico:
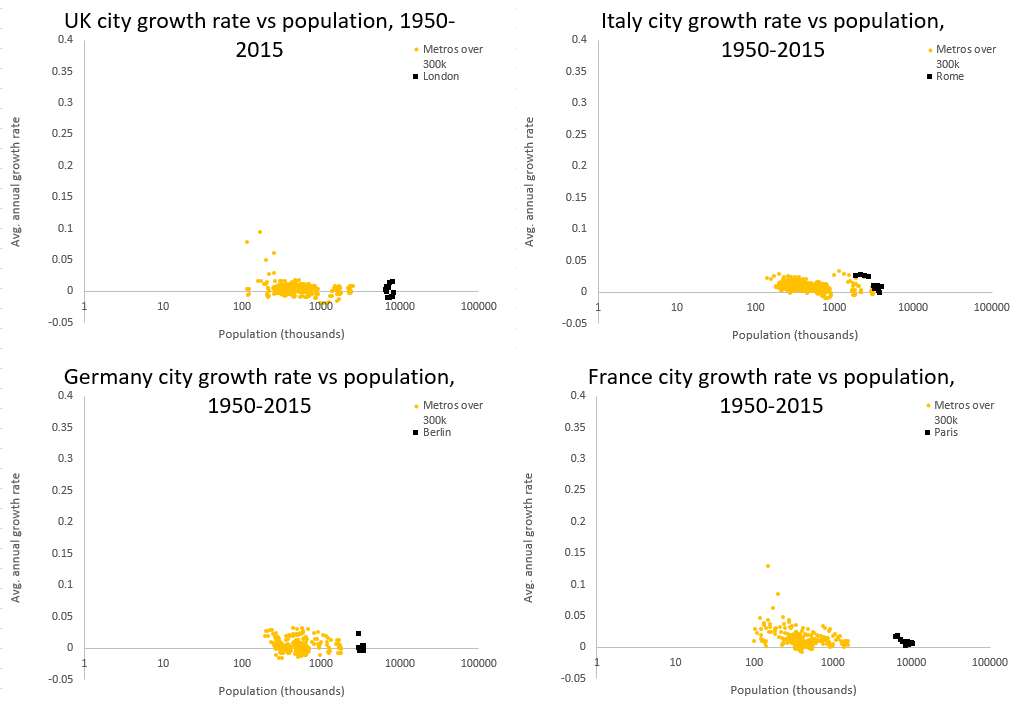
Interestingly, though, European cities seem to show a different pattern. Here are the UK, Italy, Germany, and France:
We see almost no European cities with high growth rates. Since 1950, no large German or Italian city has ever had more than a 5% growth rate, and it's only happened a handful of times for UK and French cities. No small city (less than 100,000 people) has grown into a large city in any of these countries since 1950, whereas in other parts of the world this is much more common.
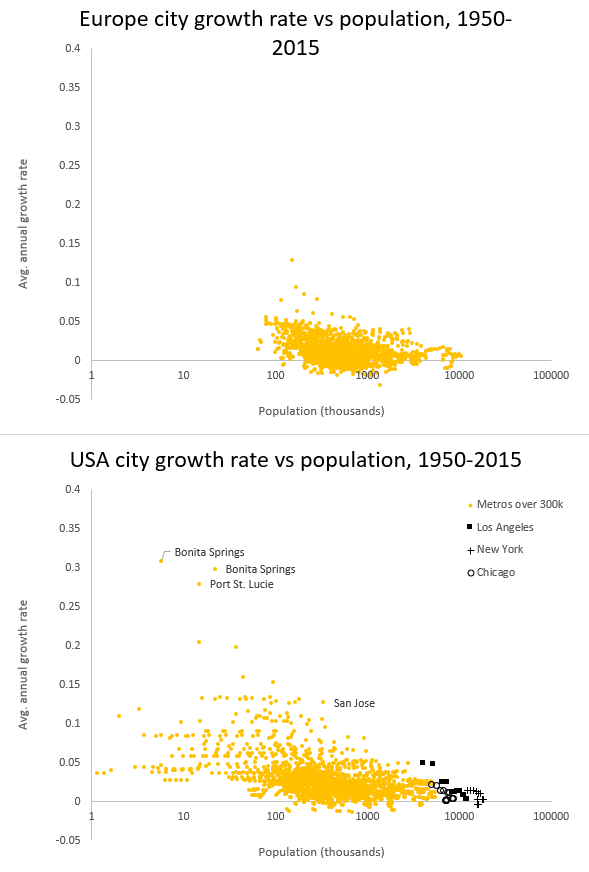
If we zoom out to look at every large city in Europe, this picture doesn’t change much. Here are European city growth rates, with the US for comparison:
So, to sum up, while cities of different sizes grow at the same rate on average, and while most cities grow in the neighborhood of 0-5% per year, smaller cities have the potential to grow faster than larger cities. A city of less than 100,000 might be able to have growth rates of 10-20% or more, and cities of up to 3-400,000 can potentially have growth rates in the neighborhood of 10-15%. Potential growth rates tend to fall as cities grow larger, and cities above 1 million people almost all grow at less than 10% per year, and usually less than 5% per year. The US, the Middle East, Southeast Asia, Africa, and South America all seem to have followed this basic pattern, assuming the data is reliable.
The big exception to these trends is China, which seems to be able to maintain much higher growth rates for at least some of its large cities. Shenzhen and Dongguan both maintained over 20% annual growth rates when their population was more than 1 million. The highest level of growth a non-Chinese city has maintained beyond 1 million people is 12% per year.
Europe, on the other hand, is an exception in the other direction. Almost no large European cities have exceeded 5% annual growth at any point since 1950.


Dongguan is right next to Shenzhen (it's the next city over as you travel North from Hong Kong), so in some sense it's really only one metro there that's experienced such meteoric growth (the historic growth of both is tied to the special economic zone there and the close proximity to Hong Kong).
Great info and sourcing, as usual, but a bit of extra input re LA seems necessary. The history of the city, county and region are essentially the same: a pattern of slow early settlement in the colonial period with a big bump when rail service started in the 1870s/1880s. Orange County split from LA county back then, but has since become a suburban satellite. Meanwhile LA County always included numerous smaller cities that did the same. Are they included in the data? It’s hard to tell; they are basically contiguous yet also separate entities. In any case LA, it’s LA County suburbs and OC are mostly situated on a largely open coastal plain. It includes Long Beach (500,000+) and Santa Ana (similar size), among others. The most recent historically significant big bump coincided with WWII and the resulting housing shortage was acute and lingered into the ‘50s - the Bush family actually lived in public housing in Compton for a short time then. Growth and sprawl continued apace for decades thereafter, eventually breaching the topographic confines of the plain and adjacent San Fernando and San Gabriel valleys and spilling over into the Mojave Desert. It has slowed considerably but isn’t really over yet; a major housing development now sits astride the freeway path to Palm Springs where recently there was only arid scrubland.