

How Long Does It Take to Plan a Bridge?
Many folks, including me, have observed that it seems to take much longer to build infrastructure in the US than it used to. People point to things like the rapid construction of the Empire State Building (one year) or the Golden Gate Bridge (just over four years) and note that for a modern infrastructure project it can take that long or longer to even get the permits or do the environmental studies.
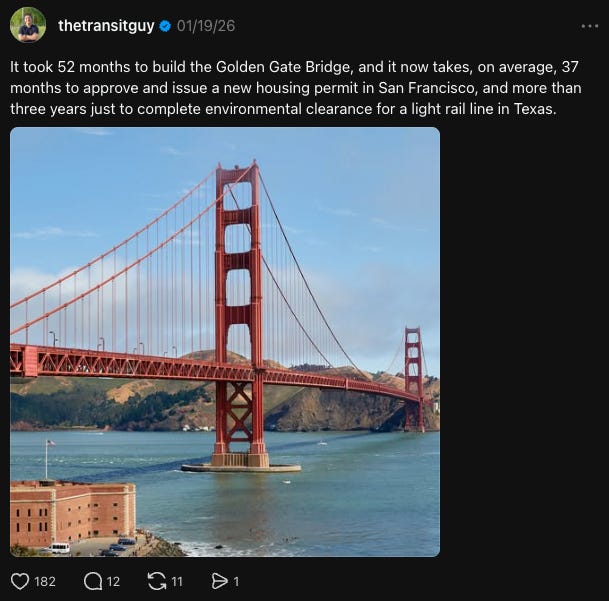
But when doing these sorts of comparisons, it’s important to compare like with like: specifically, we shouldn’t measure the time spent planning a project (which would include doing the environmental studies and securing the permits) against the time spent actually building it. (The Golden Gate Bridge, for instance, was constructed in four years from 1933 to 1937, but planning for the project began around 1921.)
I wanted to get a sense of how planning times for major infrastructure projects in the US have evolved over time. To do this, I looked at planning and construction times for 67 major bridges built in the US since roughly the beginning of the 20th century. For each bridge, I noted the year that planning began, the year that construction began, and the year that it opened for service.1
As usual with an exercise like this, the results you get will be a function of the definitions you choose. “Started construction” and “opened for service” are relatively unambiguous — but what specifically do we mean by “planning begins”? People will often float the idea of a bridge for years before anything resembling formal plans is in place; the idea for the Brooklyn Bridge, completed in 1883, apparently dates back to 1804, but it doesn’t seem reasonable to consider that early discussion the beginning of planning. On the other hand, if you choose something like “the government formally announces the project” as your criterion, that might exclude years of serious efforts to get a project constructed.
I ended up choosing the “planning begins” date as the point when some organization connected with transit planning in some official capacity first announced or proposed the project. So for the Golden Gate Bridge, this would be 1921, when Chicago engineer Joseph Strauss and San Francisco city engineer Michael O’Shaughnessy prepared a joint proposal for the bridge. However, pinning these dates down was often difficult. Most bridges aren’t the Golden Gate Bridge, with lots of publicly available sources chronicling their design and construction. Often sources give a brief “planning begins” date without explaining what that meant specifically or what activities preceded it. And for some bridges, such as the New Tappan Zee Bridge, the decision to proceed with a bridge was preceded by years of studies on possible ways to expand transit capacity that considered many non-bridge options. For these, I tried to use the initiation of broader studies as the start of planning, but I suspect that these sorts of preliminary studies weren’t always documented. Overall I did my best to determine the dates, but I expect there to be errors and inconsistencies, and the results below should be taken with a grain of salt.
Those caveats out of the way, let’s look at the data. The graph below shows planning times for each bridge on the list. The horizontal axis is the year when planning began for a particular bridge, and the vertical axis is total years of planning.
And the graph below shows construction times for each bridge.
Because there’s a lot of variation in both planning times and construction times, it’s useful to look at trends by age bracket. The chart below shows average planning times and construction times for 20-year age buckets, with pre-1900 and post-2000 bridges each given their own bucket.
There are a few trends visible here. One is that bridge construction times fell from 1900 to the 1960s, but since then have risen. The average time to construct a bridge between 1980 and 1999 (6.5 years) was more than twice as long as the average construction time for bridges built between 1940 and 1959 (3.1 years). Construction times for bridges built between 2000 and 2025 are down from this peak (5.4 years), but they’re still well above the times of the 1920s through the 1950s.
Planning timelines, on the other hand, show a somewhat different trend. At a high level, we do see something that looks like the “times fall, then rise again” pattern we saw with construction times: planning times fell in half from over 12 years between 1900 and 1919 to 6 years between 1960 and 1979, before rising again in the 1980s. But the 1980-1999 period planning times look fairly similar to every other period other than 1960-1979. It’s not clear that modern planning timelines, which are on the order of 10 years on average, are all that different from most historic ones.
More recently, post-2000 planning times look even shorter (6.2 years on average), but this data is almost certainly biased downward because the bridges with long planning times haven’t been completed yet. A bridge that started planning in 2007 but has a 20-year planning timeline won’t start construction until 2027, and thus won’t show up in the data. A similar thing is probably taking place for pre-1900 bridges, which have planning times which are biased upward (since I was mostly picking bridges that were built after 1900). So we should be careful about drawing conclusions about planning times for these age brackets.
One notable thing about recent bridge construction is that a very large fraction of modern bridges are replacements for existing bridges. Of the 17 bridges on the list that were completed after the year 2000, 14 of them were replacement bridges. Some of these were for bridges that collapsed, like the I-35W bridge replacement in Minneapolis; others were for bridges that were damaged and at risk of collapse, like the Penobscot Narrows Bridge in Maine; and some were for bridges that were near the end of their design lives, like Florida’s Pensacola Bay Bridge. All else being equal, I’d expect a replacement for an existing bridge to get built more quickly than a completely new bridge, because people will react more viscerally and negatively to a major traffic route being removed than they will for construction of a nonexistent bridge getting delayed. This visible sentiment probably creates a sense of urgency to replace an existing bridge that doesn’t exist for a completely new bridge that people haven’t developed expectations for. One illustration of this dynamic is that collapsed highway overpasses often get rebuilt exceptionally quickly. When a highway overpass in Atlanta collapsed following a fire, it was rebuilt in just six weeks. We saw something similar with collapsed highway overpasses in Los Angeles and Pennsylvania. (The long time its taking to rebuild the collapsed Francis Scott Key Bridge in Baltimore thus may be something of an outlier.)
One other notable observation: there appears to be little relationship between planning times and construction times. Bridges that take a long time to plan might get built exceptionally quickly, and vice versa.2
Which bridges on the list took the longest to plan? Here are the bridges with the five longest planning timelines.
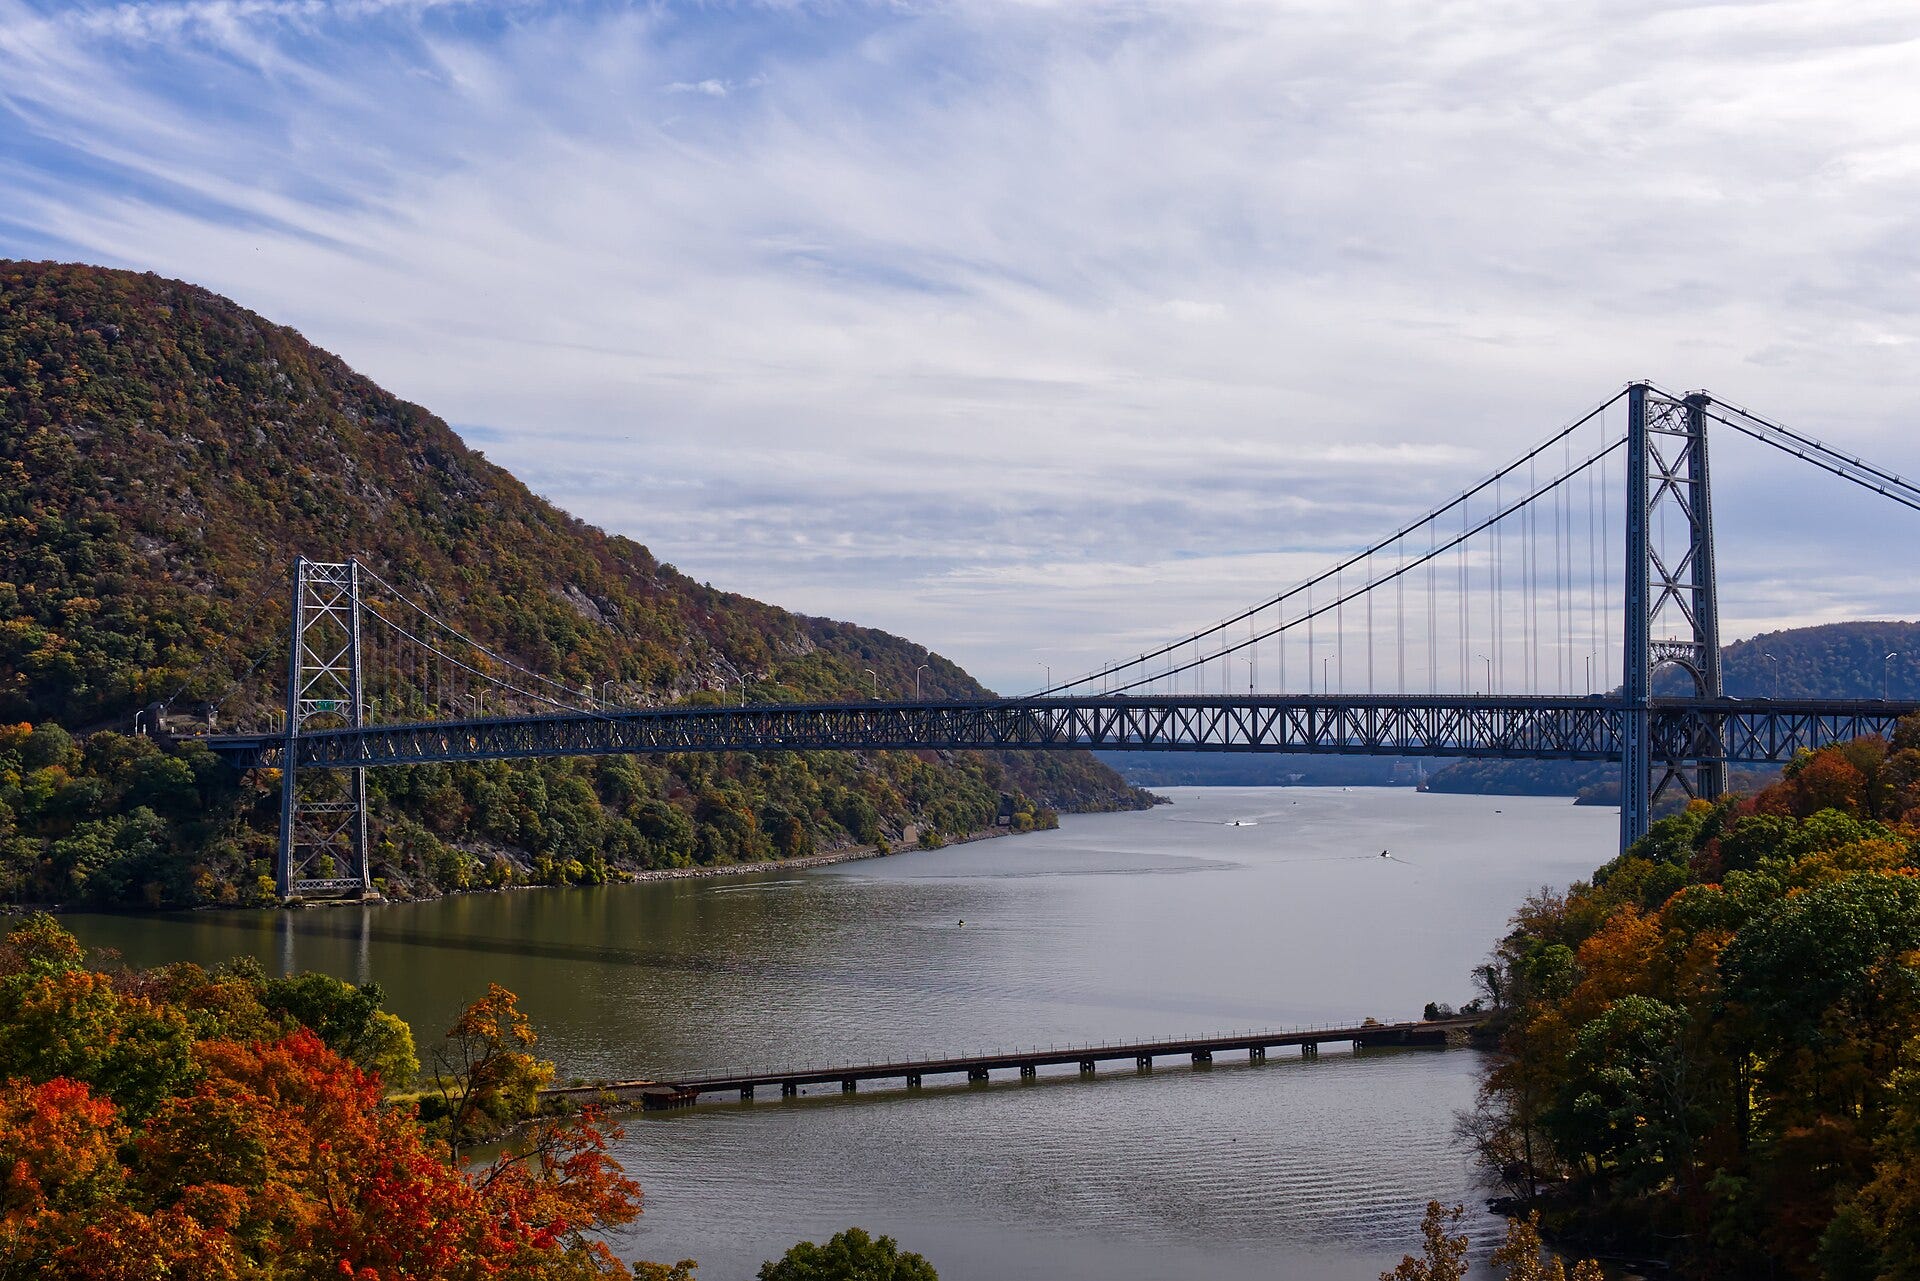
Bear Mountain Bridge, New York, 54 years — The Bear Mountain Bridge, a suspension bridge in New York, was first planned in 1868, after a bill was passed by the New York legislature. There were a series of attempts to construct the bridge over the next 30 years, but none of them was successful in building more than foundations, and construction on the current bridge didn’t begin until 1922.
Fremont Bridge, Oregon, 41 years — Planning for the Fremont Bridge in Portland dates back to 1927, when the City Council issued a “Major Traffic Street Report” which proposed a bridge across the Willamette River in the Fremont Bridge’s current location. The bridge was also suggested by the Oregon State Transportation Committee in 1933 and by Robert Moses in his 1943 planning study for the City of Portland. The site for the bridge was finally settled on in 1955, and construction began in 1969.
Queensboro Bridge, New York, 34 years — The earliest proposals for a bridge between Manhattan and Queens date back to 1804, but the first serious efforts began in 1867, when wealthy Queens residents formed the New York and Long Island Bridge Company to build the bridge. The company hosted a design competition for the bridge in 1876, but work was slow to begin, and in 1890 a state justice ruled the charter invalid. In 1900, the city took over the company’s franchise to build a bridge, and construction began in 1901.
Claiborne Pell Newport Bridge, Rhode Island, 32 years — Planning for the Claiborne Pell Newport Bridge in Rhode Island began in 1934 but was delayed until after World War II for unclear reasons. In 1948 the state created the Newport-Jamestown Civic Commission to explore ways to finance and construct the bridge, but construction didn’t begin until 1966.
Verrazzano Narrows Bridge, New York, 31 years — In 1928, the chambers of commerce for several New York boroughs announced that the Interboro Bridge Company had proposed a “Liberty Bridge” that would connect Brooklyn and Staten Island. However, a vote on the proposed bridge in the New York legislature was blocked by congressman and future New York mayor Fiorello La Guardia. This was followed by plans for a tunnel (which were then shelved), then another bridge, then another tunnel, until finally the plans for a bridge were approved in the late 1950s. Construction began in 1959.
Conclusion
Planning timelines for bridge construction in the US have not gotten obviously worse over the past several decades, though I suspect that the fact that most recently constructed bridges are replacing existing bridges is doing much of the heavy lifting here. This supports a vague notion I have that organizational success is often downstream of a culture of urgency — considering a problem important to actually solve and being willing to work hard on solving it. (You get the same sense of urgency when reading about how countries like Japan and Korea were able to build their commercial shipbuilding industries up from virtually nothing.) Perhaps the trick to making US infrastructure construction proceed more quickly is figuring out how to instill this culture of urgency in the agencies responsible for building it rather than relying on imminent infrastructure failure to create it.
I assembled this list by starting with the US entries for Wikipedia’s list of longest bridges and then removing entries that were causeways. I then supplemented this list by asking Claude Opus 4.7 which notable US bridges were missing.
If you limit this analysis to some age brackets, you can get some stronger correlations — bridges built between 1980 and 1999 have a negative correlation between planning times and construction times at R2 = -0.18 — but stretching out the windows of time tends to make these go away.
Did the bridges in the sample have comparable span and total lengths? One would assume new bridges display a strong survivorship bias towards increasingly challenging sites.
Great research, with this caveat.
I would have found the planning phase estimates to be more useful if they were devoted to the engineering/environmental related planning. I can't say for other readers, but when I think about how long a project is going to take I'm focused on the professional engineering planning (along with the construction period.) But using an announcement by politicians or bureaucrats at an agency as the start time isn't quite as clear cut as when the major professional contracts are let. When the civil engineers, and structural engineers are chosen and their clocks start, that could be a better start point. That would include enviro studies and surveys, but not include years of political fighting or zoning fighting or land purchase machinations. In sum, either when a competition is concluded and the designers are chosen or when a direct contract is established with the lead structural engineers, this approach would help limit what is otherwise a very open-ended idea of "planning" that leads to some of your listed projects going on for decades or a half century.
This approach would help avoid the future hypothetical example of the Strait of Messina bridge, which has been proposed for literally centuries, and which has had contemporaneous proposals since about 35 years ago. And even though some recent efforts have led to some engineering contracts, the reality is that the "planning" phase of the project hasn't started by my definition and only would do so when all the legal challenges are resolved and work is underway to do the detailed *design work* that leads to actual construction.