

More on US Pedestrian Deaths
Last week I wrote about the unexplained rise in pedestrians killed by motor vehicles in the US. Since 2009, pedestrian deaths have increased by almost 80%, following multiple decades of falling rates.
I looked through data on pedestrian fatalities from the National Highway Transportation Safety Administration (NHTSA), but I couldn’t find a singular explanation that satisfied me. The piece of evidence that most compelled me was this: the rate of pedestrian fatalities has increased substantially across many different states, even as overall pedestrian collisions have stayed close to constant. This suggests that pedestrian accidents are getting more deadly, which in turn suggests that the increase in popularity of big SUVs might be causing the increase in deaths. However, the number of pedestrians killed by sedans seems to be rising as well. That can’t be caused by SUVs getting bigger and more popular.
This article got lots of attention, and readers had many theories about the drivers of the increase. In this follow-up post, I wanted to further investigate some of the most compelling theories and angles on the question.
Unfortunately, this exercise left me more confused than before. What previously seemed like the most promising explanation (the rise of large SUVs) now looks less compelling. But no other explanation has emerged to take its place.
Deaths and darkness
Some folks pointed me to a New York Times article on the problem of US pedestrian deaths from 2023. Contra my original claims (that the increase in deaths doesn’t seem specific to one time of day), the NYT states that nearly all the increase in deaths is at night.
The NYT is correct; This was an error on my part that stemmed from not looking closely enough at the data behind a bad summary statistic. I was correct that there hasn’t been much change in the proportion of deaths during the hours of 6pm to 6am. But 6am is night at some times of year and location, and day in other times and places.. Lighting conditions are not just a function of the clock. If you look at deaths by lighting condition, you find that the increase in deaths is mostly in times of darkness.
Deaths in daylight are only up 28% since 2009; deaths in darkness or lit darkness (streetlights, etc.) are up 103% and 87%, respectively. On its own, this data doesn’t tell us what’s causing the increase in deaths (indeed, the NYT quotes a researcher at the Insurance Institute for Highway Safety saying, “I don’t have any definitive answers for this”), but it’s a useful correction.
Increases in speed
One theory I heard was that small increases in vehicle speed have a disproportionate impact on the deadliness of collisions, so the cause may be small increases in vehicle speed that aren’t large enough to show up in increased rates of speeding.
It’s true that the risk of death rises substantially with vehicle speed: going from 23 mph to 32 mph increases the risk of death from 10% to 25%. However, if we look at the frequency of deaths by the speed limit of the road they occur on, deaths have increased at every speed limit, including at very high speed limits (60 mph and above) where death was already virtually certain.
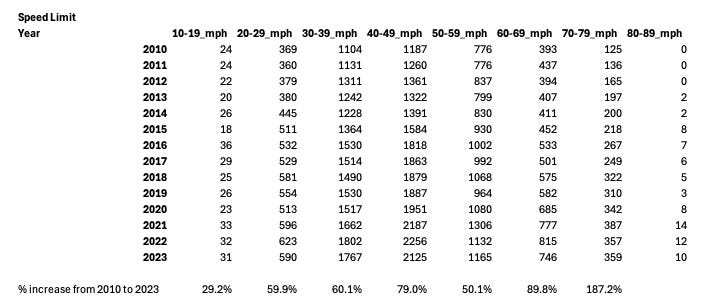
Percentage-wise, the biggest increase is actually at the top end of the scale, particularly with 70-79 mph speed limits (where deaths have nearly tripled). This doesn’t seem consistent with “minor increases in speeding” as a cause of increased deaths.
Another possibility is that speed limits have risen across the board on US roads, making them more deadly even though “speeding” (going over the speed limit) hasn’t increased. Speed limits in the US have increased, but from what I can tell this mostly started in 1995 when the National Maximum Speed Law was repealed. I found a few cases where some cities have reduced their speed limits, and some of these cities (New York, Minneapolis) haven’t had the same increases in pedestrian deaths as the rest of the country. But other cities which have reduced their speed limits (Washington, Seattle) have had increases in pedestrian deaths.
Location of deaths
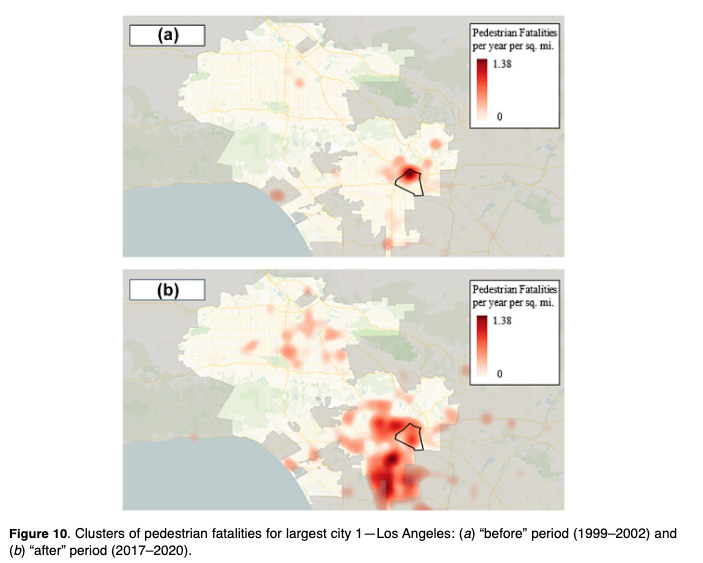
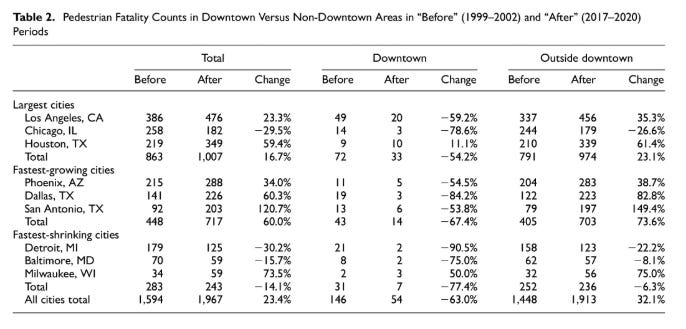
The previous article looked at the location of pedestrian deaths by state, and by type of road, but didn’t go more granular than that. I was pointed to a 2023 study that looked at changes in where pedestrian deaths are occuring. It notes that pedestrian deaths seem to have actually declined in downtowns, even as they’ve increased in suburban areas:
Pedestrian fatalities appear to be concentrating in lower-density suburbs with lower-income, lower-education, and minority populations. Where in our cities are these areas? For our three largest cities of Los Angeles, Chicago, and Houston, we see a distinct trend. In the “before” period, pedestrian fatalities were concentrated in downtown areas. In the “after” period, they have moved outwards into the suburbs. In Los Angeles and Chicago, the hot spots present in the downtown areas in the “before” periods have largely dissipated in the “after” period. Also, note that the COVID-19 lockdowns took place during our “after” period and may have affected the results.
Unfortunately, this doesn’t tell us much about what’s causing the uptick in deaths.
Covid-19
In the previous article I looked at rates of pedestrian crashes overall vs fatal crashes in several different states, noting that the fatality rate had almost always increased over time. But for each state I only looked at two times, 2009 (or as early as data was available) and 2023/2024. I decided to look at actual time series for states to see if there was anything notable. The graph below shows pedestrian crashes and pedestrian fatalities for Arizona, Illinois, Pennsylvania, and South Carolina, normalized so that 2009 values are equal to 100. (There was nothing special about these states, they were simply the first states I looked at where data went back to 2009.)
Each state has pedestrian deaths rising faster than overall collisions, and in some states collisions are falling even as pedestrian deaths are rising. But the time series also shows a jump during 2020 due (presumably) to Covid-19: pedestrian crashes suddenly have large declines, but pedestrian fatalities only show modest declines (Pennsylvania), are flat (Illinois), or increase (Arizona, South Carolina). My guess is that while daylight driving declined significantly, (due to things like people working from home), night-time driving declined much less. In Arizona, for instance, the number of daylight pedestrian crashes declined by 27% from 2019 to 2020; nighttime crashes only declined by 3%.
Distracted pedestrians
In the previous article I noted that there’s not much evidence for increased “driver distractedness” as a factor (which would include drivers distracted by phones), though it’s hard to rule out. People also wondered if pedestrian inattentiveness (because of phones or headphones) could be a factor.
Since 2010 FARS has tracked “non-motorist contributing factors,” which includes whether pedestrians were “inattentive.” However, as with driver distractedness, there’s not much evidence that this is a factor. The number of killed pedestrians classified as “inattentive” is a tiny fraction of overall pedestrian deaths.
This doesn’t necessarily mean that a pedestrian wasn’t distracted by their phone or something else: as with driver distractedness, it may simply not have been recorded (though all else equal, I would expect drivers in these collisions to happily place blame on pedestrians looking at their phones, so the fact that they’re not seems telling). Similarly, if distracted pedestrians were a major factor, I would expect pedestrian collisions overall to have increased, but they don’t seem to have (at least not consistently).
Bicyclists
Some readers wondered if a similar uptick in fatalities has been seen for bicyclists. It has: bicyclist deaths are up 86% since 2009. So whatever is causing the increase also seems to be affecting cyclists.
Demographic changes
Other than the age of drivers and pedestrians, my previous article didn’t really look at any demographic factors, and folks wondered whether there might be any notable changes in composition there.
For gender, there’s not much change for either drivers or victims: men have stayed around 70% of both:
For race, the fraction of white victims has stayed roughly constant (save for a big decline in 2023 for some reason). There was an uptick in the fraction of black victims around 2015, and a corresponding decrease in the fraction of other races.
Because “Hispanic” isn’t a racial category, we need to look at that separately. Interestingly, the number of Hispanic victims was declining until around 2017, after which it rose substantially (from 24% of pedestrian deaths in 2017 to 40% of deaths in 2023), though still within the range of what we’ve seen historically. This doesn’t quite line up with the spike in pedestrian deaths overall (which began in 2009), but it’s interesting to note.
Other readers also wondered if an increasing homeless population could be behind the increase. Evidence here seems mixed. The number of homeless in the US has been increasing in recent years, but the increase started around 2015-2017, not in 2009. This seems largely true on a state-by-state level as well.
However, although the data isn’t amazingly robust, it does seem like a large fraction of pedestrians killed by motor vehicles are homeless. In Hawaii 13 of 37 pedestrians killed in motor vehicle accidents in 2024 were homeless, and 8 in 28 in 2025. 10% of the pedestrian deaths in Clark County, Nevada from 2008 to 2011 were homeless. 22% of pedestrian deaths in San Francisco in 2018, and 15% in 2021, were homeless. 28% of Sacramento pedestrian deaths were homeless in 2024. From 2017 to 2019, 21% of pedestrian deaths in Portland were homeless. Pedestrian deaths on interstates in Atlanta are reportedly mostly homeless.
It’s also the case that the rate of death from traffic accidents among the homeless has dramatically risen in recent years. A study on the causes of death in the homeless across several different locations found that traffic fatalities had increased substantially from 2011 to 2020 (eyeballing the graph, it seems to have roughly quadrupled, from around 40 per 100,000 in 2011 to 150 per 100,000 in 2020).
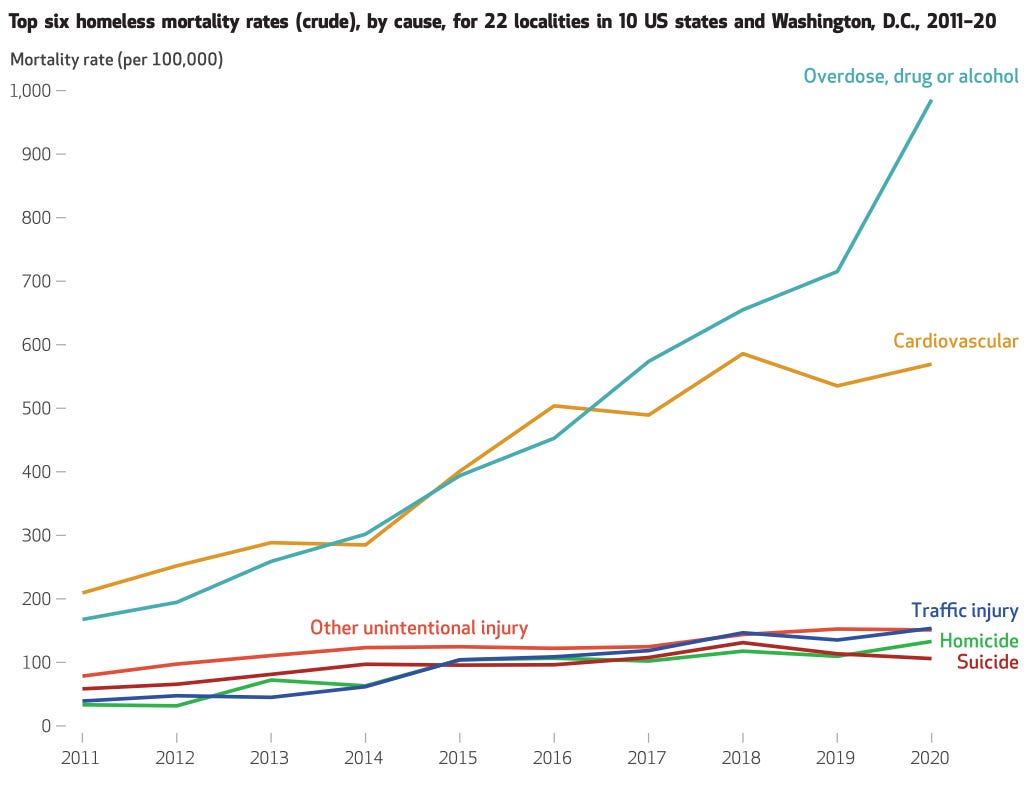
This doesn’t tell us about causation: it’s not clear if homeless are increasingly at risk because of something they’re doing ( wandering into traffic more, say), or if they’re just victims of other factors. I did find it notable that homeless mortality rates from many different causes are up substantially, and that the increase in traffic deaths is greater than the increase in pedestrian deaths more generally. It suggests that something might be causing increased homeless deaths across the board, which might also include increased traffic deaths.
It also seems that while homeless deaths are a large fraction of pedestrian deaths in cities, they’re still a relatively small fraction of pedestrian deaths overall. In 2020 there were 6,565 pedestrians killed by motor vehicles. If we assume that the death rate of 150 per 100,000 found in the study applies to the homeless population overall (around 580,000 in 2020, per HUD), that would get us around 870 total homeless killed in traffic accidents, or 13% of the total.
Big SUV skepticism, phone use theory
John Burn-Murdoch of the Financial Times wrote a piece on US pedestrian deaths in 2024, which threw some additional cold water on the big SUV hypothesis. A variety of countries have seen huge increases in the number of SUVs sold, but only the US has seen an uptick in pedestrian deaths.
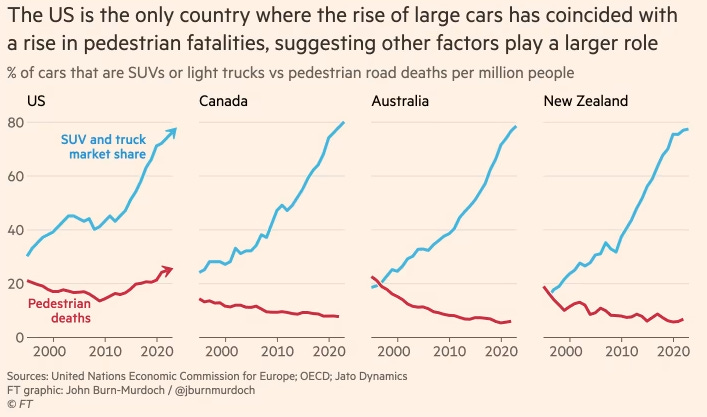
Some folks suggested that perhaps American SUVs are uniquely large and dangerous — SUVs in other countries seem like they’re often much smaller than the huge ones we have in the US. But Canada seems to contradict this. SUVs and trucks in Canada look just as large as US ones: four of the top 10 most popular vehicles sold in Canada in 2024 were the same sort of giant pickup trucks (F150, Sierra, Silverado, RAM) that we have in the US. (In fact, 8 of the top 10 US vehicles were also in the Canadian top 10.)
Burn-Murdoch also points to an economics paper which, by using data on the number of pedestrian deaths and the fraction of vehicles that are cars vs. SUVs in different states, shows that replacing SUVs with cars would theoretically have a small impact on the total number of pedestrian deaths. This doesn’t tell us much we didn’t already know (since we had already clocked that deaths from popular sedans were up substantially as well), but it’s another blow against the “big SUV” hypothesis.
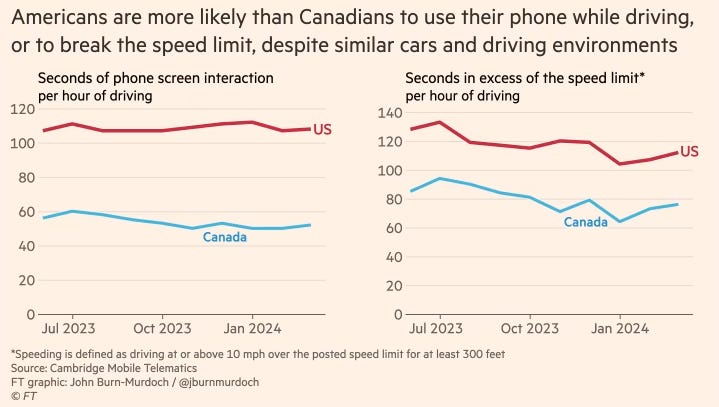
Burn-Murdoch points to some evidence that it might be phone use, showing that US drivers seem to spend much more time on their phones than Canadian drivers. But this data (which only covers a year) isn’t enough to show whether there’s been a change in US phone use over time.
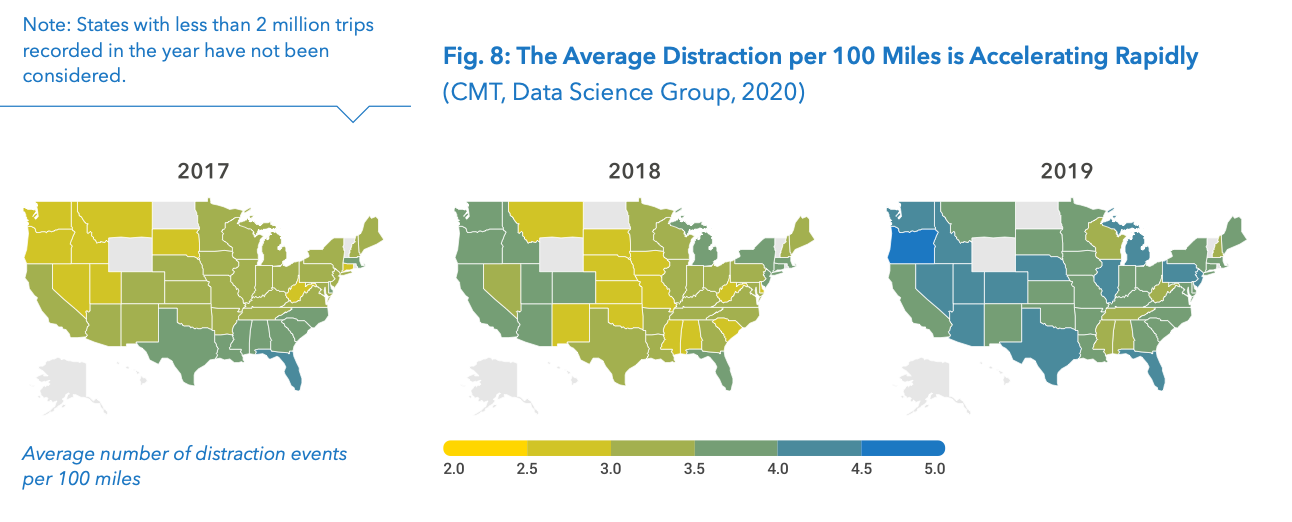
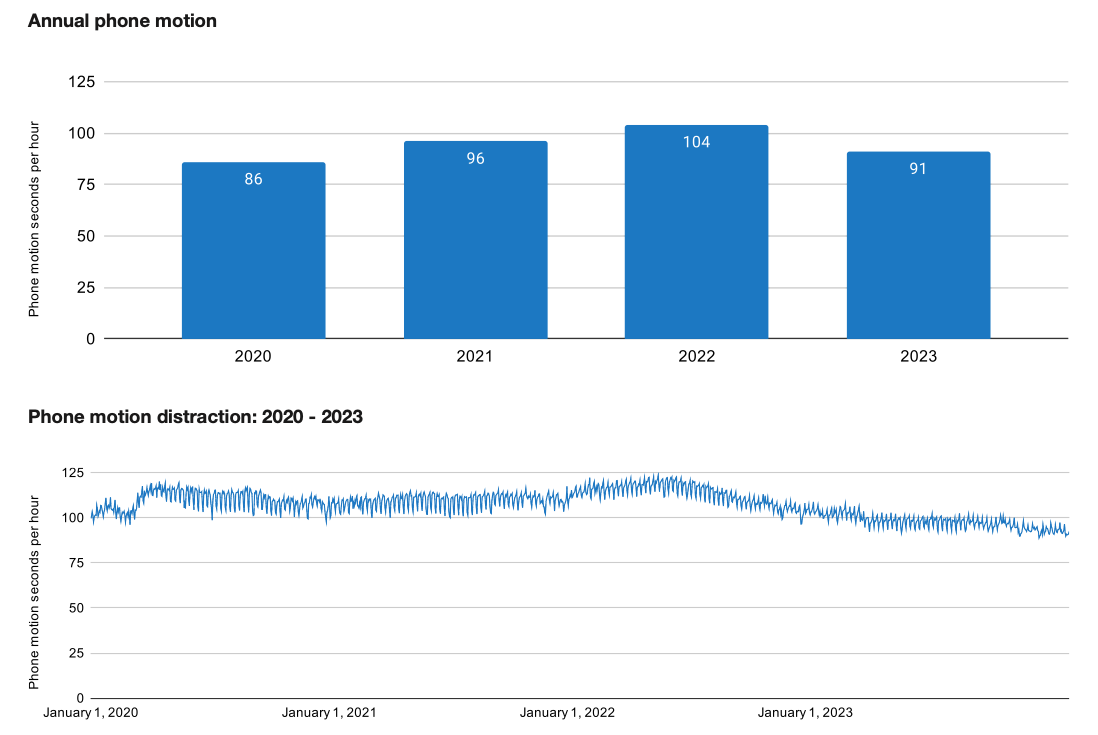
I looked up some reports from the firm that gathers this data (Cambridge Mobile Telematics), and it does seem to show an increase in driver phone use in the US over time. Its 2020 report “The Harsh Realities of Distracted Driving” shows that the number of “distraction events” (most of which are phone use) rose across the US from 2017 to 2020.
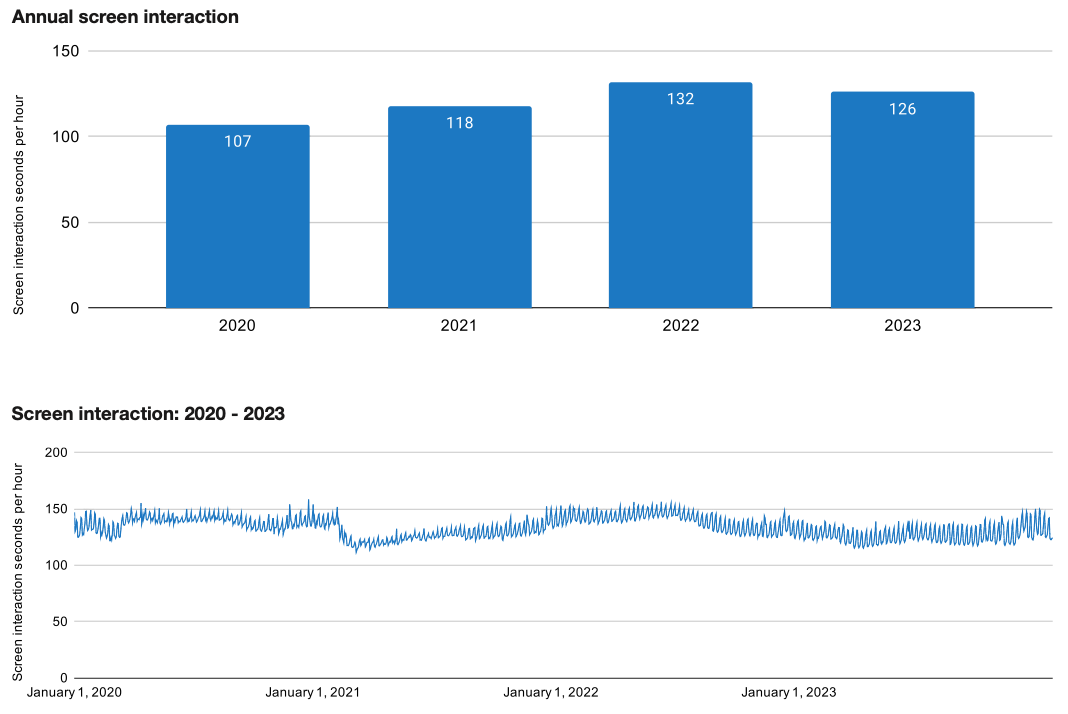
And its “The State of US Road Risk in 2024” report shows, by some measures, that phone use rose from 2020 to 2023.1
So it’s possible that US drivers simply use their phones more in the car than drivers in other countries, and that this problem has grown worse over time. This is suggestive, but I don’t think it’s definitive: if increased smartphone use were the problem, I’d expect collisions of all types to be up (which they aren’t), and wouldn’t expect the problem to be limited to night.
Driver blind spots
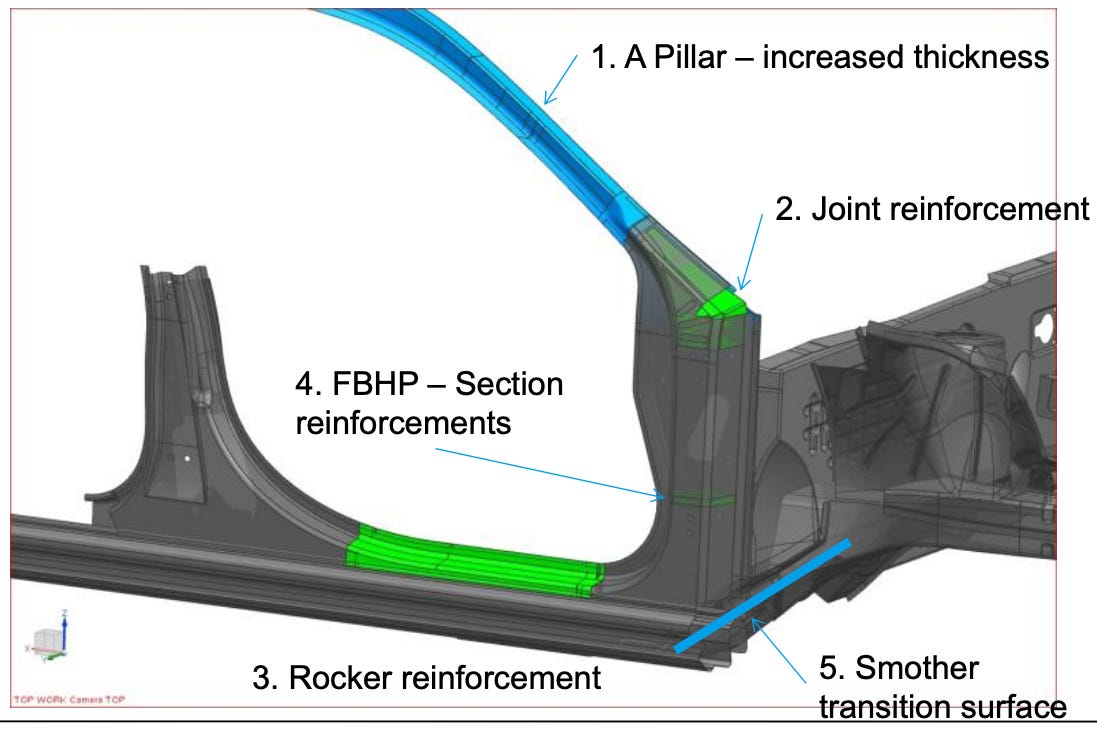
Still other readers suggested that an increase in the size of vehicle blind spots might be behind the increase. This initially seemed like a very plausible explanation. A paper from the Department of Transportation earlier this year noted that the size of vehicle blind spots has increased across a variety of US models:
This decrease seems to be partly driven by more stringent NHTSA safety standards for roof crush resistance, which incentivize making cars with very strong, robust A-pillars (the vertical pillars in front of the driver which support the roof). Making A-pillars larger and heavier makes the roof less likely to collapse, but it also impedes driver vision. New, stricter roof-crush requirements were issued in 2009 and started to be phased in from 2012-2016, which roughly aligns with when pedestrian deaths started to increase in the US (presumably some manufacturers began to change their models as soon as the new requirements were issued).
This is also potentially an area where the US is different from Europe. Europe not only has no roof-crush requirements, but it also has requirements that limit how much the driver’s field of vision can be blocked. US cars have no such requirements.
If this theory was correct, pedestrian accidents would be getting more deadly not because cars are getting larger and heavier, but because drivers increasingly can’t see pedestrians, and aren’t slowing down before hitting them. This would also explain why cyclist deaths have risen in roughly the same proportion.
Another notable item here: modern vehicles mostly have automatic emergency braking systems that will brake if they detect an oncoming collision. These systems have been recommended by the NHTSA since 2015, and have been sold on most US cars since around 2020. However, these systems apparently don’t work well for pedestrians at night. So “reduced driver visibility” could also partly explain why the increase in deaths is mostly occurring at night, and why we don’t see a large increase in collisions more generally — AEB systems are preventing most additional collisions, but nighttime pedestrian collisions are slipping through. This could at best be a partial explanation though, since the introduction of AEB doesn’t really align with the uptick in night-time pedestrian deaths.
However, once again Canada throws a wrench into this explanation. Canada has very similar vehicle safety requirements as the US, including no limits on driver visibility obstructions and similar roof crush standards as the US. The NHTSA actually publishes a list of harmonized Canadian and US vehicle standards, which includes the roof crush requirements (FMVSS 2016 in the US, CMVSS 216 in Canada), and apparently it’s not uncommon for new vehicles to be certified for sale both in the US and Canada. If increasingly large blind spots in US vehicles was the driver of the increase in pedestrian deaths, I’d expect that to also show up in Canada as well. But they don’t.
Conclusion
Looking more deeply into possible explanations for the rise in US pedestrian deaths has left me more confused than before. Our most promising original explanation — increasingly large SUVs — was already somewhat shaky, and now looks even less promising. Other countries have had similar increases in SUVs without a corresponding increase in pedestrian deaths. The most promising new explanation — an increase in the size of US vehicle blind spots — is hard to square with the fact that Canada has very similar vehicle safety regulations as the US (and thus presumably a similar increase in driver blind spots, though I haven’t verified this), but hasn’t seen an uptick in pedestrian deaths. The “distracted by phones” theory seems somewhat more plausible to me now, but I still wish there were stronger evidence here.
We did uncover some interesting new factors. The increased deaths are mostly taking place at night. Cyclists’ deaths have increased by roughly the same amount in percentage terms. Deaths seem to be occuring less in downtowns, and more in suburban areas. A large fraction of pedestrian deaths are homeless (though probably not large enough to entirely explain the increase), and the rate of homeless killed in traffic accidents has increased dramatically in recent years, as has the absolute number of homeless in the US. The fraction of victims who are Hispanic (many of whom are likely also homeless) has risen dramatically since ~2017. But once again, these factors don’t point to a single clear explanation. Are homeless people increasingly likely to wander into traffic, or are they simply the most common victim of some other increase in road deadliness? If it’s the former, why? Is the increase in Hispanic fatalities connected to an uptick in illegal border crossings (this seems hard to square with the fact that illegal border crossings were down/flat from 2009 to around 2020)? Despite diving deeper into the question, I somehow feel like I know less than before.
My (unsatisfying) current theory is that the increase in pedestrian deaths is due to a multitude of small factors (an uptick in homelessness, an increase in drug use, a reduction in traffic law enforcement, etc.) and/or some sort of complicated multi-factor interaction (such as reduced driver forward visibility exacerbating American’s tendency to use their phones while driving). But I’m not particularly confident of this.
There’s research that could be done to better try to pin down this question. More extensive studies of vehicle blind spots, across the US, Canada, and Europe could tell us how much these have been changing in different places. It also seems like a large-scale study using telematics data and phone-use data, tracking things like whether drivers are using their phones prior to collisions, how fast they’re travelling, how much they slow down before impact, and so on could reveal a lot about collisions and phone use that we don’t currently know (though there are obviously potential privacy issues here).
These graphs do not seem especially consistent to me. For both of them, I don’t see how 2023 could have higher annual phone motion than 2020, when the time series shows it consistently below it.
Right around that time headlights got blindingly bright for oncoming vehicles, I wonder if this plays a role
In the section on phone use, you say that it doesn't explain why the increase is so concentrated at night. But it could easily be that phone distraction is more dangerous at night than during the day: maybe it wrecks the driver's night vision, or maybe distraction is more impactful when visibility is bad. For example, a driver during the day might notice a pedestrian far down the road and decide to refrain from using their phone until they pass, whereas in a similar scenario at night, the driver is unaware of the pedestrian, decides to check their phone, and doesn't notice the pedestrian until it's too late.
More broadly, I've long suspected that US driving culture is the most carefree among economic peers. I've heard that in most other countries, licenses are harder to get and easier to lose. The US vs Canada cellphone data supports the carefree hypothesis. Other data to test it might be rates of license revocations or rates of new drivers passing their first driving test. The driving culture theory wouldn't explain the post-2009 timing or the concentration at nighttime by itself, but it could combine with one of the other factors to produce the specific effects we're seeing here.