The Grid, Part II: The Golden Age of the Power Industry
Welcome to Part II of our history of the electric power industry. For Part I, see here.
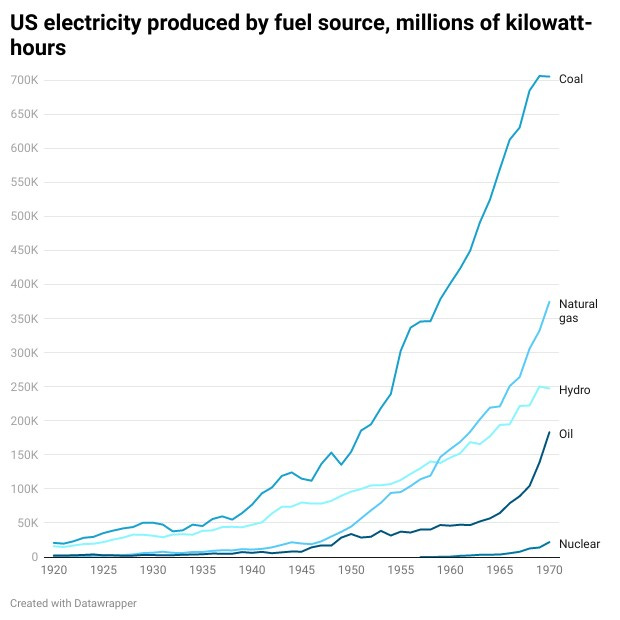
By 1930, the US was using 114 billion kilowatt-hours of electricity a year, generated by more than 4000 power plants. Most electricity was generated by coal (56%) and hydroelectric (34%) plants, with the remainder generated by natural gas and fuel oil.[0] 68% of homes overall, and 84% of homes in urban areas, had electrical service. Electricity had, in the words of Franklin Roosevelt, become “no longer a luxury,” but “a definite necessity”:
It lights our homes, our places of work and our streets. It turns the wheels of most of our transportation and our factories. In our homes it serves not only for light, but it can become the willing servant of the family in countless ways.
Between 1902 and 1930, electricity generation in the US increased by more than a factor of 20. But growth of the industry slowed during the 1930s due to the Great Depression. By 1940, the residential electrification rate had only risen by 10%, and generation capacity had only increased by 25%, compared to a 100% increase in generation capacity over the previous 10 years. Increase in power plant size similarly stagnated, and the maximum size of steam turbines would remain flat until the 1950s.
Nevertheless, electrification progress continued during the 1930s, much of it under the banner of federal New Deal programs. The most well-known electric power project of this era is the Hoover Dam, which was the largest hydroelectric plant in the world when it was completed in 1936. But the Hoover Dam was just one of many federal hydroelectric projects built during the 1930s, including the enormous Bonneville Dam and Grand Coulee Dam. Six dams were built and operated by the newly created Tennessee Valley Authority, a federal electric utility and economic development organization created in 1933. From 1931 to 1941 federal hydroelectric projects made up 20% of new US electric generating capacity.
In addition to hydroelectric projects, during the Depression the federal government also oversaw the construction of extensive transmission and distribution infrastructure. The Public Works Administration financed the construction of 31 transmission line projects across 20 states between 1933 and 1935. In 1935, Roosevelt created the Rural Electrification Administration (REA) to provide electricity to farms and rural areas. When the REA was formed, only 12% of farms had access to utility-provided electric power – due to low population density, few utility providers were willing to construct the necessary transmission and distribution infrastructure. By providing low-cost loans for rural electricity cooperatives to build electrical infrastructure, the REA gave millions of farms access to electric power. By 1950, the farm electrification rate had reached nearly 80%.
During the 1930s, the federal government also began to regulate the electric power industry more stringently, largely in response to the collapse of Samuel Insull’s utility empire. By the early 1930s, Insull had built “a complex of utility and related properties whose power lines and gas mains stretched from Maine to Texas and from Wisconsin to Florida, serving over 5000 communities in 32 states” (Lambert 2015) This amalgamation was held together by complex arrangements of stock ownership: high level “holding companies'' held the stock of lower-level companies, which in turn held the stock of even lower companies, and so on down to the level of the thousands of small utility companies that provided electric service. In the aftermath of the stock market crash in 1929, the value of Insull company stocks fell, and its financial structure became stressed. Collapse ultimately came in 1932 when a young Arthur Andersen analyzed the accounts of Middle West Utilities, one of Insull’s largest holding companies, and found the company was “retroactively insolvent, never having earned any money and thus but a worthless pile of paper” (Lambert 2015).
(Arthur Andersen’s firm would go on to become one of the largest accounting firms in the US until 2002, when it would cease operations due to its associations with the misleading bookkeeping of another energy company — Enron).
In the aftermath of the collapse, Congress passed the Public Utility Holding Company Act (PUHCA), which significantly increased regulation of electric power holding companies and subjected them to SEC supervision, along with the Federal Power Act, which authorized the Federal Power Commission (today the Federal Energy Regulatory Commission, or FERC) to regulate interstate sales of electric power. In an effort to avoid federal regulation, many utilities cut their interstate ties, something we still see remnants of today with Texas’ independent electrical grid.
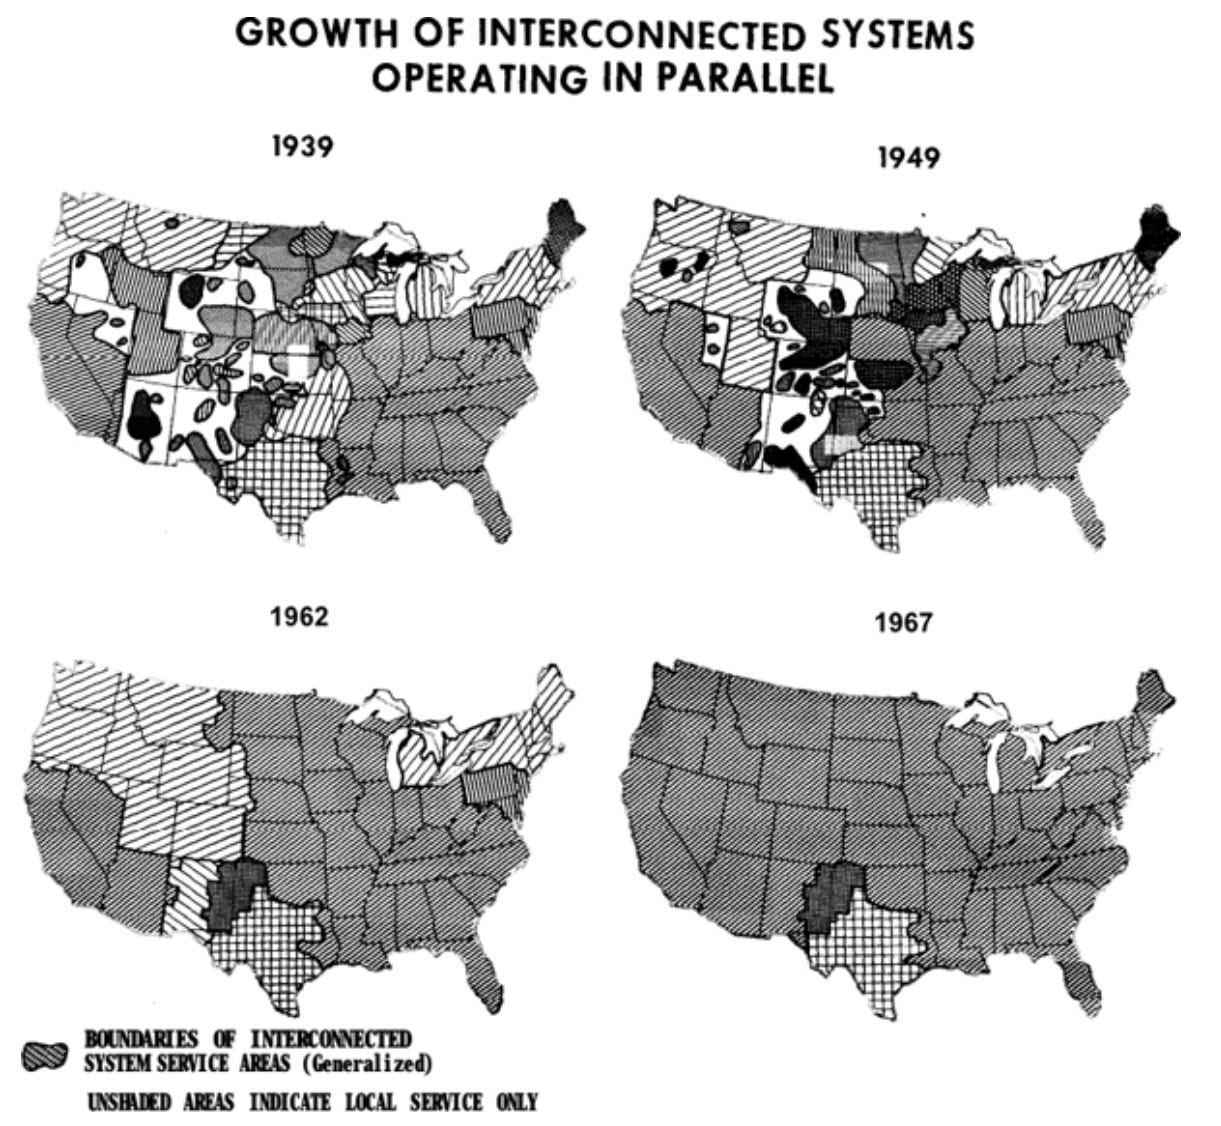
Despite increased federal regulation, the broader trend of more interconnections between electric power providers continued. By 1938, 44 power companies across 14 states had tied their systems together to form the ‘Interconnected Systems Group,’ covering 450,000 square miles. By the late 1930s, several hundred systems traded power across state lines.
The trend towards interconnection accelerated during World War II to meet the enormous electric power requirements that war production demanded. Enormous production facilities sprang up across the country, requiring electricity in new places. Between 1939 and 1944, manufacturing output tripled and gross national production doubled, as the US produced enormous amounts of tanks, planes, ships, and other war material. Production of aluminum and magnesium alone required “one seventh of all the electricity used in the country for all purposes in 1940” (Olds 1942). It was easier to add generating capacity by interconnecting grids than to build new power plants, given wartime material shortages. Interconnection would also make the electric power system more resilient to potential enemy attack.
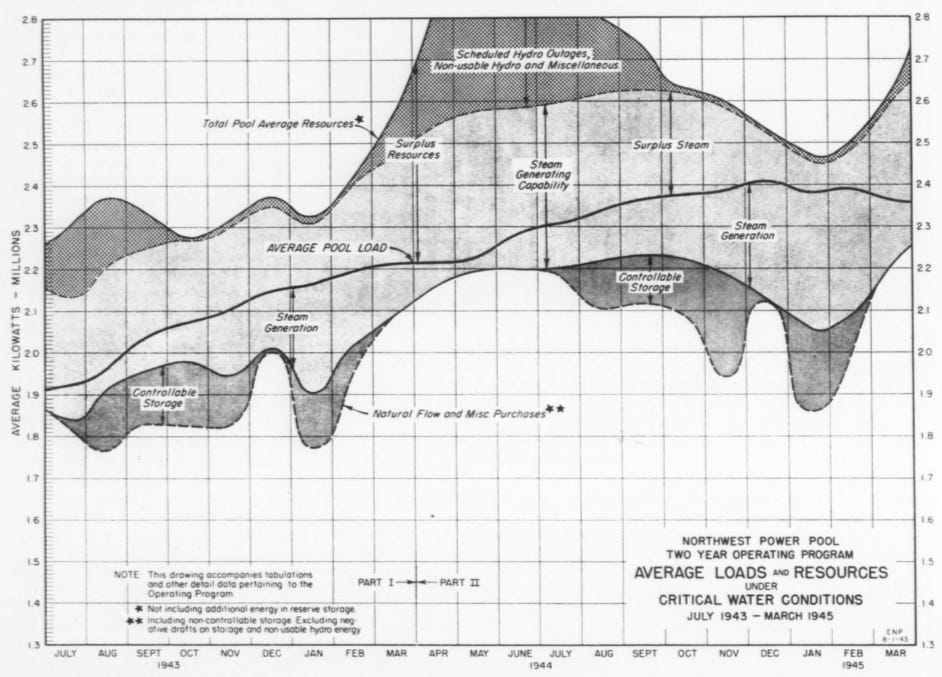
During the war, the Federal Power Commission ordered the construction of several interconnections, and many utilities formed large power pools to share power. The Northwest Power Pool, formed in 1942, was able to provide an extra 100 megawatts of power by aggregating hydroelectric resources with different flow rates and having a more diverse customer load. Similarly, 11 Southern utility companies formed the Southwest Power Pool to ensure continuous power could be provided to an Arkansas aluminum plant. Due to increasing economies of scale from interconnection, between 1940 and 1945 power consumption increased by 60%, while generation capacity only increased 25%.
The golden age of electric power
After the war, in what later became known as the “Golden Age” of the electric power industry, the electric power industry continued the expansion that had been derailed by the Depression. Between 1945 and 1965 US electricity generation capacity increased by a factor of 4, and power generated increased by a factor of 6. The generation capacity spike came hand in hand with an explosion in household electricity consumption, from an average of 1200 kilowatt-hours per year to almost 5000 kilowatt-hours per year. Appliances such as vacuums, refrigerators, radios, and irons reached nearly 100% adoption, and newer technologies such as air conditioners, color TVs, and electric stoves grew in popularity.
The electric power industry grew at roughly 7% annually, more than twice as fast as the economy overall. By the 1960s, the electric power industry was the largest industry by assets in the country, nearly as large as the next two largest combined (oil refining and railroads). And though electrification was increasing around the world, by 1962 the US still used more than 40% of the world’s electric power.
The grow and build strategy utilities adopted in the 1910s and 20s continued to be successful. Power plants became larger and more efficient. Maximum steam turbine size went from 208 megawatts in 1950 to 1000 megawatts by 1965, and reached 1300 megawatts by the early 1970s. In 1948 there were just two power plants in the US larger than 500 megawatts in capacity. By 1972, there were 122 plants. Thermal efficiency more than doubled between the late 1930s and the mid 1960s. Increased economies in production meant the price of electricity continued to fall, declining nearly 60% in real terms between 1945 and 1965.
New electrical generation capacity largely came from new coal plants, though all types of power plant increased in generation capacity. Natural gas power saw a robust increase, from 7% of generation capacity in 1945 to 20% in 1964.
To get this power to customers, utilities built nearly 80,000 miles of transmission lines between 1950 and 1963. Increasing transmission voltage allowed the efficient transfer of power over longer distances.

Utilities continued to join large power pools, and by 1964 “nearly 200 major systems or pools aggregated power from the vast majority of the 3600 entities producing electricity” (Cohn 2017). By the 1960s, most electric power providers had tied their systems together into a small number of interconnected systems. Industry experts expected this project to culminate in a single electrical grid that would tie the US together.
End of the Golden Age
But in the late 1960s, the grow and build strategy that had governed the electric power industry for decades began to unravel.
One major factor was the environmental movement, which in the late 1960s and the early 1970s brought attention to the environmental costs of unchecked power system construction. The construction of new electric power plants became increasingly expensive and time-consuming. Environmental activists used legislation to block the construction of new hydroelectric facilities and nuclear power plants, and the Clean Air Act of 1970 mandated pollution controls on coal plants, increasing their capital cost. The National Environmental Policy Act (NEPA), passed in 1969, required environmental review of federal actions for potential environmental consequences, including the construction of nuclear plants and transmission lines, slowing down projects. Nuclear power plants, on which the electric power industry had bet heavily, were hit particularly hard by this social shift. Constantly escalating safety requirements for nuclear power plants resulted in nuclear plant costs far in excess of their projections. The 1970 National Power Survey noted that blocking the construction of electrical infrastructure had forced a reduction in “the margin of assurance of electrical service”, as utilities shed load to avoid system overload, leading to voltage reductions and localized blackouts.
At the same time, the technical improvements behind continuously falling costs of electric power began to taper off. Plant thermal efficiency, for instance, had continually increased since Edison constructed his first plant at Pearl Street in 1882, but in the 1960s hit diminishing returns. Higher plant thermal efficiency required higher steam temperatures and pressures, and it became increasingly difficult to design equipment that could handle it. In the mid 1960s, steam temperature and pressure in turbines stopped increasing, and between 1965 and 1980 there was essentially no increase in thermal plant efficiency.
Cost decreases had also been driven by economies of scale from building increasingly large power plants, but these too fizzled out in the 1960s. Increased efficiencies of larger power units began to be offset by their increasing complexity – larger units had more components, which required more maintenance and increased the likelihood of failure. Between 1960 and 1972, fossil fuel units larger than 600 megawatts had five times the downtime of smaller units. Larger facilities generated more waste, and required larger pollution-abatement systems. Larger steam turbines were difficult to cool, and metallurgical problems made fabrication of longer turbine blades challenging. In the late 1960s and early 1970s, manufacturers encountered quality problems with large-capacity equipment that had been scaled up too quickly, and power units largely stopped getting bigger in the early 1970s.
Technical issues also plagued the transmission system. The end of the Golden Age is typically marked by the 1965 Northeast blackout, which left 30 million people without power for up to 13 hours. The blackout resulted from a cascading failure after a single relay on a transmission line carrying power from Niagara Falls to Toronto “tripped,” stopping the flow of power. The excess power was rerouted to other transmission lines, which tripped more relays, and in 12 minutes the entire Northeast was plunged into darkness.
Power failures weren’t uncommon, but they had never occurred on this scale. The Northeast blackout revealed the downsides to interconnection – in a highly interconnected power system, a failure in one place could potentially spread widely. After another blackout occurred in the Pennsylvania-New Jersey-Maryland (PJM) interconnect in 1967, the Federal Power Commission received increased authority to regulate electric system reliability, and 12 large power pools formed the National Electric Reliability Council (NERC) to set standards for electric power reliability.
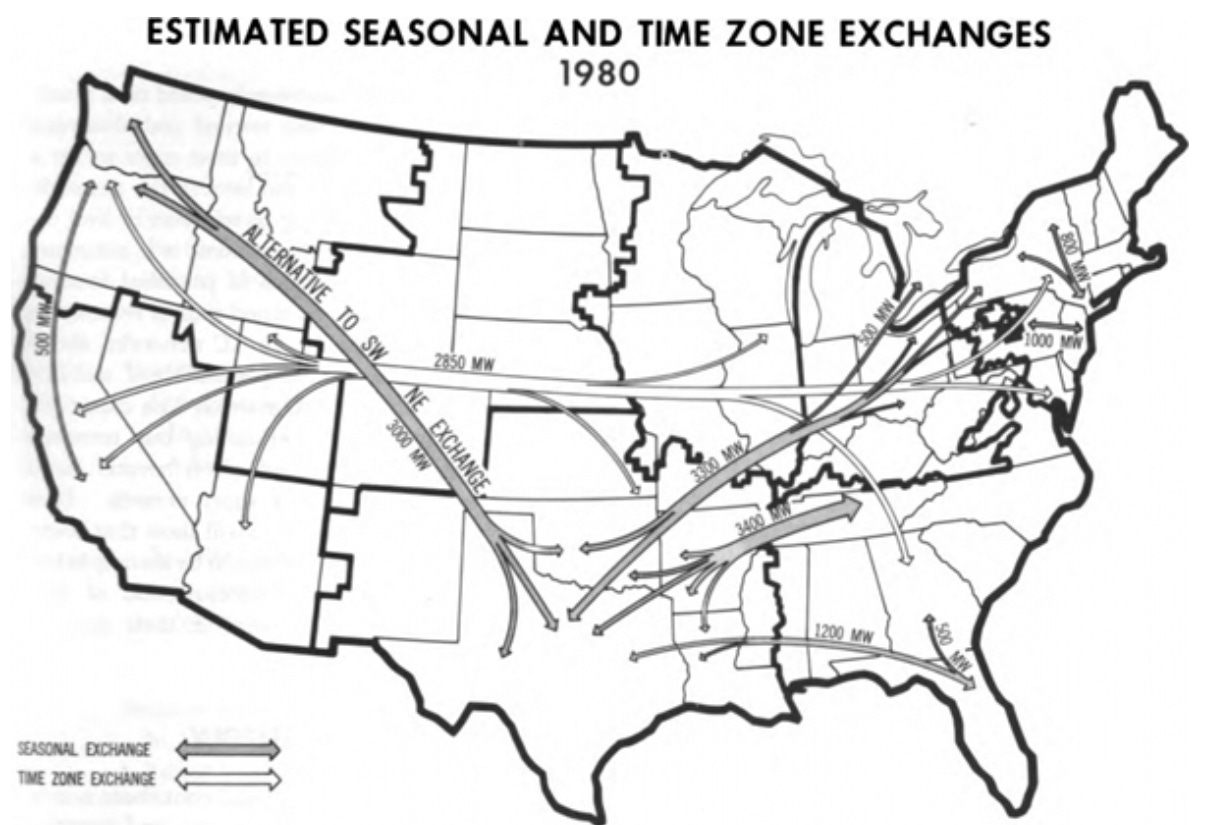
Despite the blackouts, progress continued toward the goal of a single nationwide electric grid, but technical problems occurred on this front as well. In 1967, the Eastern and Western interconnects were connected by four AC interties in what was known as the “Golden Spike Operation,” linking the US power grid into a single enormous machine that spanned from coast to coast (exclusive of Texas). However, the resulting grid proved highly unstable. As one NERC official noted, the AC ties “weren’t strong enough to hold the two masses of energy together. As loads changed, the power would swing, and the lines would trip out, separating the networks. It got to the point where it was happening as many as a dozen times a day” (Cohn 2017). After 8 years of operation, the AC ties were removed and later replaced with high voltage DC transmission lines. Unlike AC transmission lines, which require every generator connected to the grid to operate in sync, DC transmission lines allow the sharing of power between two separate grids without requiring them to be synchronous. Today, the US electrical grid still consists of three separate synchronous grids – the Eastern Interconnection, the Western Interconnection, and the Texas Interconnection – which can share power over high voltage DC transmission lines.
Technical problems were likely exacerbated by shifting perceptions of the power industry. In the early days, electric power had been considered a “high tech,” daring, and innovative industry, and it was able to attract the best engineering and management talent. But as the industry matured, it grew to be perceived as more conservative and dull, and talented engineers and managers increasingly moved into the more exciting fields of electronics and aerospace. One utility manager bemoaned that there were “too many C minus students in the utility industry” (Hirsch 1989). The number of power engineering programs offered by universities reflect the decreased interest in electric power. Whereas 150 schools in 1935 had offered power engineering programs, by 1966 they could be “counted on the fingers of a single hand” (Hirsch 1989).
The cherry on top was the energy crisis of 1973, which drove up the costs of both fuel for power plants and financing for the construction of new facilities. The crisis also precipitated a slowing growth for electric power demand. Whereas electric power use had historically increased at roughly 7% annually, this ceased in the mid-1970s.
At the same time, for the first time in its history, the price of electricity rose, and the power industry became an increasing cost industry. Between 1973 and 1983 the price of electricity increased nearly 30% in real terms.
With industry growth slowing, and costs of electric power rising, the era of “grow and build” was over. No longer could the industry continue to improve economies of electricity generation by operating at larger scales. As a result, the state-granted monopoly status of electric power generation began to be questioned, and the stage was set for industry deregulation.
Sources
Books
The Power Makers - Maury Klein 2008
Empires of Light - Jill Jonnes 2003
The Grid - Julie Cohn 2017
Networks of Power - Thomas Parke Hughes 1983
Technology and Transformation in the American Electric Utility Industry - Richard Hirsh 1989
Power Loss - Richard Hirsh 1999
Turning Points in American electrical history - James Brittain 1977
Edison’s Electric Light - Robert Friedel and Ben Israel 2010
Central station electric service - Samuel Insull 1922
Electric Power System Basics for the Nonelectrical Professional
The Power Brokers - Jeremiah Lambert 2015
Routes of Power - Christopher Jones 2014
Electrifying America - David Nye 1990
Papers and other sources
Central electric light and power stations and street and electrical railways with summary of the electrical industries - US Census 1915
From Shafts to Wires - Devine 1983
Edison’s Three-wire system of distribution - Paul 1884
Hydroelectric power: The first 30 years - Allerhand 2020
Cassier’s magazine issue on Niagara power - 1895
Results accomplished in distribution of electric power by alternating currents - Emmet 1896
Interconnected Electric Power Systems - Sporn 1938
Advantages and possibilities of electric power line interconnections
A Contrarian History of Early Electric Power Distribution - Allerhand 2017
Early History of the A-C System in America - Chesney and Scott 1936
The making of an industry: electricity in the United States - Granovetter and Mcquire
From novelty to utility - Usselman 1992
The Birth of an Industry - Lieb 1922
The Economics of Gateway Technologies and Network Evolution: Lessons from Electricity Supply History - David and Bunn 1988
Materials for Incandescent Lighting - Anderson 1990
Footnotes
[0] - Statistics are for utility-provided electricity. In addition, there was also electricity generated directly by industrial plants.


“By 1930, the US was using 114 trillion kilowatt-hours of electricity a year“
Is this right? The stats I found say we currently use only 4 trillion kilowatt-hours of electricity via the modern grid (the 4 would be closer to 10 before efficiency losses and like 30 if you include non-grid energy, but still less than 100).
Maybe it should be 114 trillion watt hours per year in 1930?
I would be fascinated by an analysis of economies of scale for today's power generation tech. If the grid didn't already exist, how big would the most efficient plant be? Or plant + storage to deal with demand load variance? What if you applied an arbitrary carbon tax?