

Which Construction Tasks Have Gotten Cheaper?
We spend a lot of time around here looking at construction costs, and whenever we do the same story emerges: construction never gets cheaper. Construction costs tend to rise at or above the level of overall inflation. A square foot of building costs as much or more to build today as it did in the 1950s.
But this type of analysis only gets us so far. “Construction” actually consists of thousands of separate tasks: digging foundations, pouring concrete, nailing studs, attaching drywall, painting siding, and so on. It would be useful to peek under the hood and see if we can understand how construction costs are changing on a task-by-task level.
Fortunately, the data needed to do this exists. A variety of construction estimating guides give cost breakdowns (materials, equipment, and labor) for hundreds of different construction tasks.

The most popular of these guides are probably those produced by RSMeans, which has been publishing estimating guides and construction cost data since the 1950s.
To understand how the costs of specific construction tasks have changed over time, I bought two old versions of RSMeans estimating guide: one from 1954, and one from 1985. By comparing the costs of tasks in these older versions to the current, 2023 version, we can track the costs of individual construction activities over almost 70 years.
I was able to find 40 construction tasks that existed in each version of RSMeans; they’re listed below. The tasks cover a variety of different trades, and overall give a fairly reasonable cross section of the work that's involved in constructing a building.

It’s notable that so many construction tasks are the same over the course of nearly 70 years. Theoretically, this could pose a problem for us, if we fail to consider that some tasks have been replaced by different tasks, accomplishing the same result more cheaply. If we tried to measure the cost of computing over time by tracking the cost of ferrite core memory, it would look like there’s been almost no improvement. But that’s because ferrite core memory was replaced with different, cheaper types of computer memory. But in practice, for construction, the majority of old tasks remain fairly standard practice today.
Let’s start by looking at how the costs of performing these tasks have changed over time. The table below shows the average rate of cost increase for each task, minus the CPI rate from 1954-1985 and 1985-2023. A value of zero means the task’s cost rose at exactly the level of CPI inflation, while a positive/negative value rose faster/slower than inflation.

Overall, we don’t see a single trend in how the costs of individual construction tasks are changing over time. In both periods, about half the tasks rose in cost faster than inflation, and about half of them rose slower than inflation. Interestingly, if we take the average rate of cost increase for all the tasks in each period, you get almost exactly the CPI inflation rate.
We also see that there’s not much correlation between average rates of cost increase in each period. Many tasks that rose faster than inflation from 1954-1985 rose slower than inflation from 1985-2023, and vice-versa. Overall, about half the tasks switch signs, rising in costs more in one period and less in another.
We also don’t see much consistency in the rate of cost increase in similar sorts of tasks. Installing marble tile, for instance, rose in cost less than inflation in both periods, but installing terrazzo flooring has not. Concrete masonry rose in cost faster than inflation until 1985 and slower than inflation afterwards, but brick veneer masonry shows the reverse pattern. And if we look at just the tasks that have consistently gotten cheaper over both periods (highlighted in yellow), there’s no obvious unifying factor at work separating them from other types of tasks.
In a histogram, we see a peak around 0%, suggesting that most tasks, most of the time, are rising in cost fairly near the level of overall inflation.

So on a task-by-task basis, we see quite a bit of variability. Some tasks are rising in cost faster than inflation, while some are rising slower, and this changes over time and from task to task. But on average, costs seem to rise at roughly the overall inflation rate, which is what we’d expect.
We can hazard a guess at some explanations for cost trends of individual tasks, though this is more difficult than you might think. The price of aluminum metal fell nearly 50% from 1954-1985, which perhaps explains why the cost of installing various aluminum products (gutters, windows, handrails) fell during that time. But aluminum metal also got cheaper between 1985 and 2023, and didn’t result in these tasks uniformly getting cheaper during this period (aluminum gutters and railing does, aluminum siding, windows and downspouts don’t). Pneumatic nail guns would have been novel in the 1950s but much more common in the 1980s, lowering the cost of anything that could be nailed, such as joist framing, exterior walls, plywood, and joist hangers. Chair rails and crown molding, however, are also installed by nailing, and didn’t get cheaper in this period. And interestingly, the 2023 RSMeans gives a cheaper "pneumatically nailed" option for many of these tasks, which didn't exist in 1985. This suggests the real benefit from nail guns came after 1985, which is surprising to me. Heavy construction equipment may have gotten better between 1954 and 1985, explaining the fall in cost of piling of all types, and possibly chain-link fencing. And appliances of all types steadily got cheaper over time, so water heaters got less expensive in both periods.
Other task trends are more perplexing. It’s hard for me to understand why installing anchor bolts got so much more expensive from the 1950s to the 1980s, for instance.
If we look at the proportion of costs over time, we see that in general, labor becomes a much larger fraction of costs between 1954 and 1985, but between 1985 and 2023 it becomes a smaller fraction of costs. But there’s variability here as well:

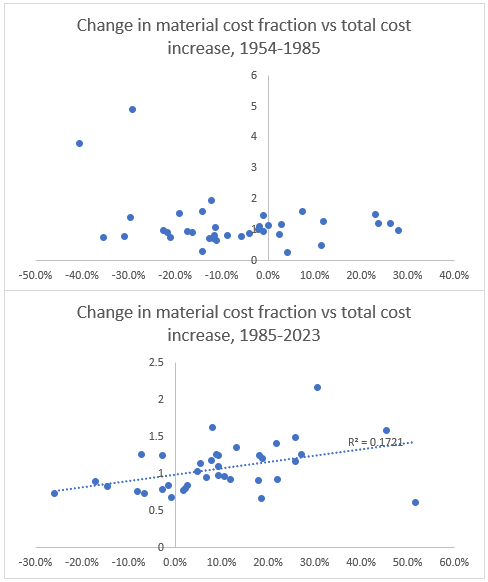
If we look at the rate of cost increase vs. change in labor/material fraction, we don’t see much of a relationship. Tasks where labor becomes a much larger fraction of the overall costs don’t have the largest overall cost increases.
Productivity
We can also use this data to track changes in construction labor productivity - the amount of labor a given construction task takes.
There’s a few different ways we can do this. The most straightforward is to take data from RSMeans directly. In the 1985 and 2023 versions, RSMeans gives the average amount of work (number of anchor bolts, linear feet of gutter, etc.) a worker or crew can be expected to do in a given day. For tasks where the size of the crew doing the work has changed, I’ve scaled install rates to be consistent in per-worker terms.
Using this data yields the following:

About half the tasks had unchanged labor productivity, about 1/4th got less productive, and about 1/4th got more productive. Once again, we don’t see major consistency across similar tasks. We see some nail gun-based tasks get more productive (plywood, 2x6 framing), but others (installing joist hangers) don’t. Installing aluminum gutters gets more productive, but not aluminum downspouts. Brick veneer installation gets more productive, CMU masonry is unchanged, and stone veneer gets less productive.
One trend we do see is in concrete placement, with both concrete tasks getting less productive over time. Terrazzo flooring, another concrete-based process, also got less productive over time.
We also don’t see a terribly strong relationship between whether a task got more productive and its change in cost over the same period. Plenty of tasks rose in cost faster than inflation despite getting more productive.
Interestingly, there's not a terribly strong relationship between the productivity ratio and the change in cost over the same period. While tasks that got more productive slightly trend toward also getting cheaper (and vice versa), the trend is minimal. Plenty of tasks rose in cost faster than inflation despite getting more productive, and plenty of tasks got cheaper despite getting less productive.
Overall, by this metric, we see the familiar trend of stagnant construction productivity - on average there has been no change in construction productivity in the last 38 years.

The other way of looking at productivity changes is by calculating it directly. RSMeans gives the unit labor cost for each task, as well as the average hourly rate for different types of construction worker. By dividing labor cost by average hourly rate, we get the amount a worker can install per hour in different periods of time.
Because many tasks are done by crews of different types of workers, we’ll simplify this by only looking at tasks performed by one of two types of trades: carpenters and sheet metal workers. This gives us 17 tasks to look at, a respectable amount. According to RSMeans, both trades have roughly tripled their nominal wage between 1985 and 2023, an increase similar to the average hourly wage increase of construction workers over that time.
RSMeans doesn’t give individual trade hourly rates for 1954, so we’ll cheat and simply use the average construction wage increase over that time.
This metric gives us a very different result than the data provided directly by RSMeans. According to this metric, nearly every construction task listed has gotten more productive over time.

As an example of the discrepancy, consider joist hangers, which are installed by carpenters to hold up floor joists. In both 1985 and 2023, RSMeans states that a carpenter can, on average, install 165 joist hangers in a single day. In other words, productivity hasn’t changed at all.
But looking at labor cost tells a very different story. From 1985 to 2023, according to RSMeans the labor costs to install a single joist hanger went from $0.95 to $2.05, or slightly more than doubled. But over the same period of time, carpenter wages more than tripled. This suggests that a carpenter today takes just 2/3rds of the time to install a joist hanger than they did in 1985. Nearly every task that we look at shows this same basic pattern: productivity calculated by looking at labor costs has increased much more than productivity based on provided install rates.
It’s not clear to me the source of this discrepancy. Both the 1985 and 2023 RSMeans assume an 8 hour workday, so a change in the number of hours per day isn’t the culprit. One possible explanation is that each individual task is taking less time, but workers are doing fewer tasks in a day, perhaps because they’re being slowed down by overhead tasks (waiting for inspectors, filling out forms, doing safety training, etc.). But I would assume that these types of overheads would be lumped into unit labor costs. After all, what good is an estimating guide if it omits a large fraction of the actually incurred labor costs? Also, RSMeans gives an “overhead and profit” adjustment, which hasn’t seen consistent changes between 1985 and 2023.
Another possible explanation is that the average daily install rates RSMeans gives aren’t correct, maybe because it doesn’t bother to update them very much. In other words, it's the calculated productivity, which shows large productivity increases over time, which is correct.
This is possible, but I also don’t find it particularly satisfying - for one, as we’ve seen, RSMeans is definitely updating these in some cases. For another, it's strange to simply ignore some of the data RSMeans provides out of convenience - if you’re not going to trust some of the numbers, why bother trusting any of them?
Alternatively, there could have been some change in how RSMeans allocates costs between materials and labor (or its performing this allocating incorrectly). This could explain why, between 1985 and 2023 for instance, for 3/4ths of tasks materials became a larger fraction of the cost, even though wage inflation was higher than CPI inflation over this period. But as with the previous explanation, I don’t find ‘selectively distrust some of the numbers RSMeans gives’ particularly satisfying.
Of course, it’s possible that we shouldn’t trust any of the data RSMeans gives - maybe estimating guides just aren’t accurate in general. But this, I think, is too skeptical. RSMeans doesn’t just make up its numbers, but gets them by having a bunch of construction industry experts call up building materials suppliers, union halls, contractors, and vendors to ask them for prices and install rates. In some cases, it will go so far as to go into the field to perform measurements, or perform time and motion studies to figure out how fast a given task can be performed. RSMeans, and other estimating guide companies like Craftsman, have been in business for nearly 70 years selling their costbooks to builders, developers, and other people in the construction industry. It’s hard to imagine them successfully being in business all that time if their products aren’t providing some value in the form of somewhat accurate costs. Developers I’ve talked to don’t take RSMeans numbers as gospel, but neither do they think they’re totally divorced from reality - accurate to within +- 15% is something I’ve commonly heard. And there are also things like the fact that Craftsman’s built-up estimate of the cost of a single family house very closely matches the per-square foot costs of new homes tracked by the Census. So I don’t think “estimating guide costs are divorced from reality and provide no useful information” is the right answer either.
So overall, I find this analysis confusing.
Conclusion
Looking at construction costs on a task-by-task basis, we see a significant amount of variability over time, with some costs rising faster than inflation, some rising slower, with them averaging out to a rate of increase close to the overall CPI inflation rate. For some tasks we can hazard a guess as to what might be causing the relative rates of cost change, but in general there’s not a huge amount of consistency in which tasks get more expensive and which ones don’t.
If we look at productivity on a task-by-task basis, we see some conflicting trends. The install rates provided by RSMeans suggest that overall, construction productivity is changing little. Between 1985 and 2023, most tasks had an unchanged per-worker install rate. But if we try to calculate productivity by looking at task labor costs, we see an (apparent) significant increase in productivity over time. It's not clear the source of this discrepancy, or if this increase in productivity is “real,” but understanding it might help shed light on why construction productivity does not seem to improve.
I notice your discussion and charts about the rate of price changes relative to CPI over time are a little bit misleading. If I understand correctly, you are comparing the rate of change in CPI over each time period to the rate of change of each process' price during the same period, setting up %changeCPI -%changeProcessPrice to get the over/under percentages. However, you then say that most of the changes are about zero, with histogram buckets of -.3 to 1.7%. That is actually a huge range considering the data you are looking at, because the CPI change is in single digit percentages.
From 1954-1985 the CPI grew ~8.8%, and from 1985-2022 ~5.2% (according to https://www.rateinflation.com/ and my quick math.) Therefore a changing price 1% greater than CPI between 54 and 85 is growing at a rate 11% faster than CPI; 1% above CPI 85-22 is a 19% greater rate. In other words, a bucket spanning roughly 2% absolute range around zero should definitely hold the vast majority of your data, because it would be shocking to have points far outside there.
To look at it another way, at 5% inflation prices double roughly every 14 years, but at 6% inflation they double every 11.6 years, 17% less time from an addition of 1% to the rate (adding 20% of the base rate).
Another consideration:
Perhaps this points to an increase in the total number of tasks being inserted into housing.
Let's say a very simple and humble SFH in the 50's was put up - they might not even have put insulation in the walls in a temperate environment or be required by a permitting office to do so, or only installed 1 outlet per room.
If the number of tasks to build a modern home has twice the number of steps or tasks that alone could explain increases in costs, even if each individual task had gotten significantly more cost effective over time.