

Why Are Homes in Western States So Expensive?
Earlier this month I came across the following graphic, originally posted on Reddit in 2022, showing the state of housing affordability in the US.

The graphic color-codes counties based on the ratio of median home value to median household income:
Green counties have median home value less than 4 times median household income.
Yellow counties have a median home value between 4 and 6 times median household income.
Light red counties have a ratio between 6 and 10
Dark red counties have a ratio greater than 10
The most obvious pattern here is the huge sea of red counties in the western half of the US. In the rest of the country expensive housing is mostly concentrated around major metro areas, outside a few hotspots like South Florida and the Blue Ridge Mountains. But in the West it seems to be everywhere.
If we dive into this pattern, the explanation appears to be a simple case of high demand. While there’s high demand and high home prices in major metro areas around the country, western states are unusual for having high demand in rural areas as well.
Housing affordability in the western US
We can easily recreate the above graphic by using Census data for median home value and median income. It’s not an exact match due to slightly different data sources, but the basic pattern remains: western counties have a much higher ratio of median home values to median incomes (4.87) than the US as a whole (3.07). This pattern remains if we restrict it to just rural counties. In counties with 10,000 homes or fewer, the ratios are 4.05 in western counties and 2.59 in the US overall.12
If we look at home values and household income separately, we can see that the pattern of unaffordable housing in western states is driven by high housing costs. Outside of metro areas, most of the US is a sea of counties where median home values are low. There are six states that don’t have a single county with a median home value over $300K, and seven more states that have three counties or less above $300K. By contrast, western states have numerous counties with high median home values. California has 17 counties with a median home price above $700K, Colorado has five, and Utah has two. By contrast, New York, Virginia, and Massachusetts all have two apiece, and New Jersey and Pennsylvania have none. The median home value in western counties is around 1.7 times the national median, and this ratio holds both for all counties and when comparing only rural counties. Median incomes, by contrast, are only about 10% higher in western counties. Western state households earn more than average, but not enough to make up for very high home values.
One possible explanation is that homes in western states are bigger than average, or on larger lots. But neither of these appear to be drivers. We don’t have county-level data (or even state-level data) on home size or lot size, but if we look at regional Census data we can see that homes in western states have been similar in size to homes in the US overall for the last 50 years:
Similarly, lot sizes in western states have been smaller than the national average as far back as we have data.
Another possible factor is that western states have higher construction costs. This actually fits as an explanation, but only a partial one. Construction costs (as tracked by the median price-per-square foot of new single family homes exclusive of the lot) are higher in western states, but only by around 30% over the last 10 years, and 20% if we go back to the 1990s. Since western homes are on average around 70% more expensive than homes in the rest of the US, this leaves a substantial cost difference that still needs to be explained.
Outside of physical factors like home size, lot size, and building cost, the most obvious explanation for higher home prices is simply demand: more people want to live in western states than in other parts of the country, the supply of homes isn’t keeping up, and this is pushing up the price of housing. Several indicators point to this being the case. Vacancy rates (the ratio of unoccupied homes to overall homes, excluding vacation homes) are lower in western states than in the rest of the US.
Western states have also grown in population faster than the rest of the US. Between 2000 and 2024 the US population as a whole grew by 20%, but in western states it grew by 27%. And in rural areas, the difference is even greater: overall population growth in rural areas in the US since 2000 has been less than 1%, and if you average the growth rates of individual rural counties, the rate is actually negative. Rural counties in western states, by contrast, have grown in population by 16% since 2000. Over the last several decades rural areas in much of the country have been hollowed out as people move to cities and major urban areas. In western states, however, this hasn’t occurred.3
This manifests in what are some very surprising home prices relative to location. Sheridan is a town on the northern edge of Wyoming, very close to what I’d call the middle of nowhere. It has a population of around 18,000, and is more than 100 miles from any major city or international airport. And yet if you look at home prices, they’re through the roof. Basic suburban houses cost close to $300 per square foot. This is substantially more than the per-square-foot value of my home in metro Atlanta. Burley, Idaho is also a small town (population around 12,000) far from any major metro area, with the cost per square foot of new homes in the $230-$250 per square foot range. Both cities have seen robust growth: 18% and 25%, respectively, between 2000 and 2020.

Housing demand in western states
What's driving the high housing demand in western states?
Some of it may be due to higher economic growth. Counties in western states have a somewhat higher rate of GDP growth than the US. But the difference is fairly small, and rural counties in western states actually have a lower rate of GDP growth than rural counties in the US overall. (Interestingly, some of the counties with highest rates of GDP growth are the hollowed-out rural areas in the Great Plains.)
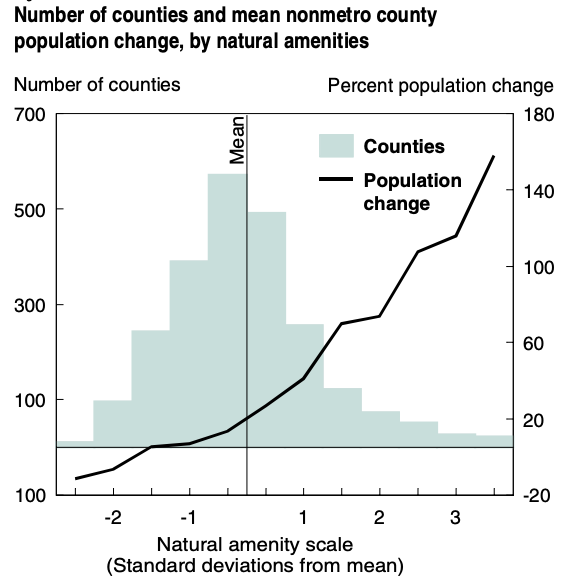
Another possible explanation is that the geography of western states is especially attractive: comfortable climates, beautiful mountain views, and so on. One measure of this is that 31 of the 53 national parks in the continental US are in western states.4 But for our purposes, a better measure of this sort of attractive geography is the USDA’s Natural Amenity Scale. The Amenity Scale measures several different features that make a place desirable to live: mild winters with lots of sunlight, a temperature climate that’s not too humid in the summer, access to water, and varied topography. The scale currently ranges from around -6 (Red Lake County, Minnesota) to around 16 (Miami-Dade County, Florida). We can see that western counties rank very highly on this metric. The average index in the US as a whole is around 0, but for western counties it’s almost 4 points (~1.6 standard deviations) higher.
(We can also see that the pocket of expensive homes in western North Carolina, right near the Blue Ridge Mountains, also ranks highly on the Amenity Scale compared to the surrounding areas.)
And in fact, western states are actually rising on the Amenity Scale over time. The original scale was calculated using temperature data averaged from 1941 to 1970, but for the map above I recalculated it using modern temperature data (2010 to 2025). The map below shows the change in the Amenity Scale between those two time periods. Many western states have had rising amenity indices (more attractive climates), while in the South and East Coast scores have fallen (the climate has gotten worse).
Previous studies have found a strong correlation between high amenity scores and high population growth in rural areas. The 1999 paper “Natural Amenities Drive Rural Population Change” found that rural counties that scored highest on natural amenities grew more than 140% between 1970 and 1996, while rural counties that scored lowest on the Amenity Scale actually shrank by around 15%. Natural amenity scores ended up being more predictive of population growth than poverty rate, population density, type of economy (whether it’s primarily farming, manufacturing, mining, etc.), and adjacency to major metro areas combined.
If we compare natural amenity scores to more recent rural population growth, we see the same pattern (counties with higher amenity scores have higher growth rates), but it's much weaker than it used to be. While from 1970 to 1996 rural areas highest in natural amenities grew by more than 140%, they grew at a much more modest 31% from 2000 to 2024 .5
Similarly, the correlation between amenity score and growth rate in rural counties is much weaker than it used to be. An attractive climate and geography thus seems to be only part of the reason why western states are seeing higher demand.
Conclusion
Regardless of the source of the demand, western states are seeing higher demand for housing than the rest of the country, and it’s likely a major driver of their higher-than-average housing costs.
Some of the commentary on the original housing affordability graphic argued that this shows the terrible record of housing construction in the western states, and how burdensome it is to build there. There’s some evidence that this is the case. The Wharton Residential Land Use Regulation Index (WRLURI) measures how restrictive residential land use regulations are. Less-regulated communities score lower, while more regulated communities score higher. Topping the list are places like San Francisco, New York, and Seattle; at the bottom of the list are places like St. Louis, Detroit, and Cincinnati.
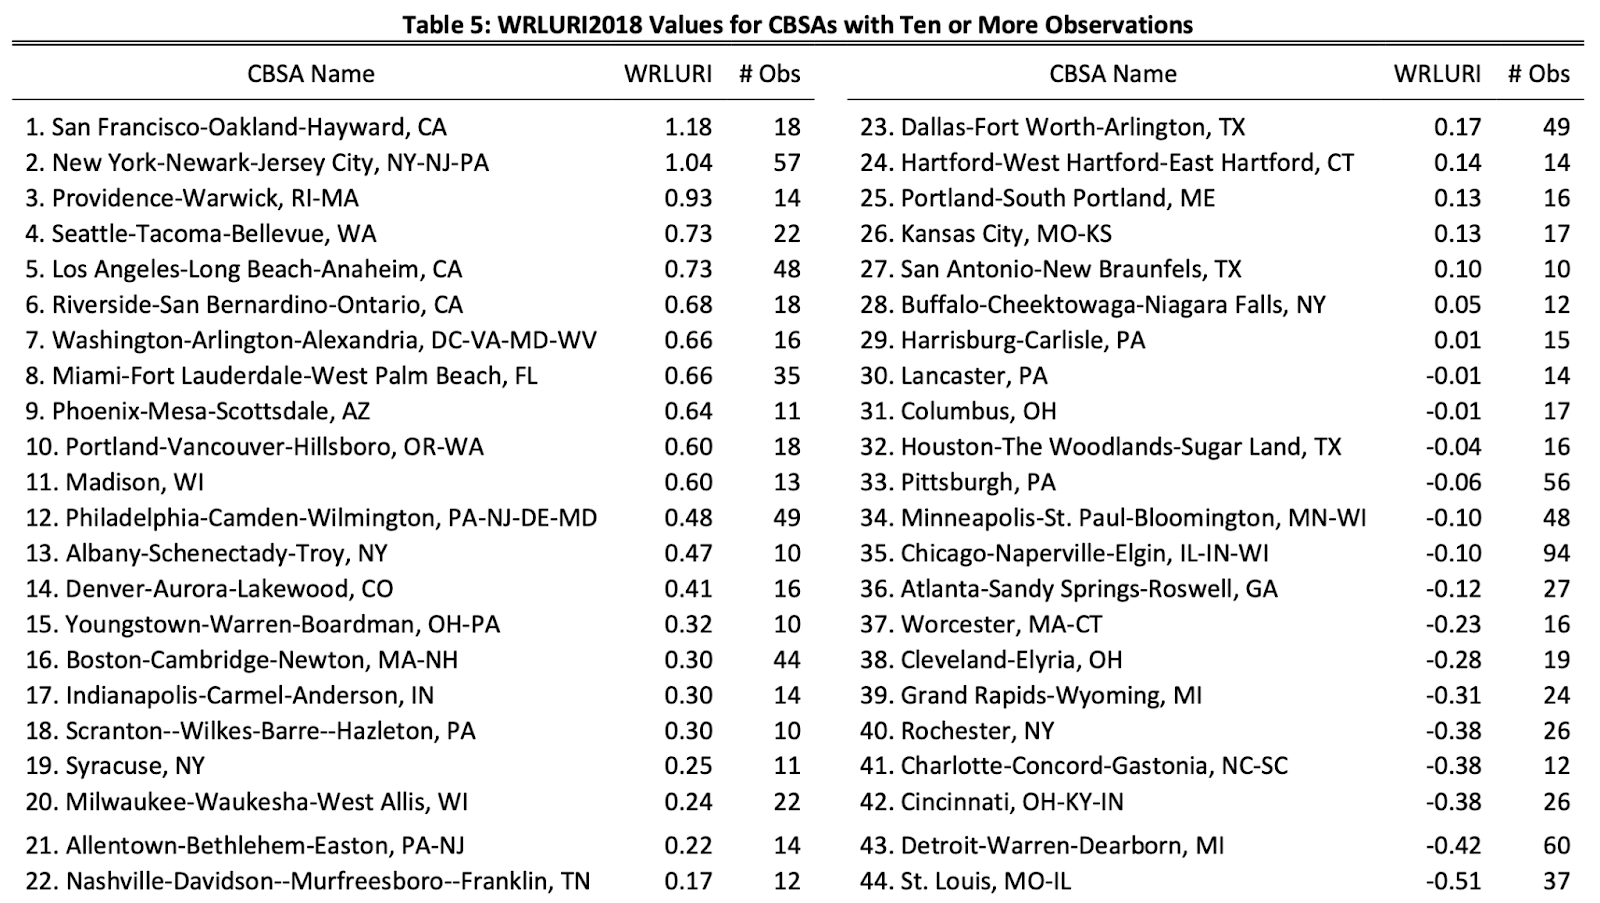
If we aggregate the data by county, we find that counties in western states have a substantially higher index than the country as a whole. Aggregated by county, the average WLURI in the US as a whole is about -0.12. In western counties it's about 0.24, or around 0.36 points (~0.41 standard deviations) higher.6 (However, if you don’t include California counties, the average WRLURI for western counties drops to around 0.12).
More generally, I think what these graphics show is how much the US struggles to build sufficient housing wherever there’s demand for it. We see this reflected in the high housing prices in major metro areas around the country, regardless of what state they’re in. What’s notable to me about western states isn’t so much that their housing policy is unusually bad (it seems to be worse than the national average, but probably not that much worse outside of California).7 Rather, it’s that western states face an unusually high level of demand outside of major metro areas. While most rural counties in the US are losing population, rural areas are gaining population in western states, partly due to the attractive climate and geography. The high prices of houses in western states and rural areas mostly demonstrate that we’re not building enough housing anywhere that it’s actually needed in the US.
The original is from 2022, whereas I used data from 2023. And the original used Zillow, Redfin, and Realtor.com data for home values, not Census.
The western states I’m including are: California, Nevada, Arizona, Oregon, Washington, Idaho, Utah, Montana, Wyoming, and Colorado. I’ve excluded New Mexico since it doesn’t seem to show the same pattern of high home prices.
Note I’m using a slightly different definition of rural here. Earlier I used fewer than 10,000 homes, whereas now I’m using fewer than 20,000 people.
Not including New Mexico, which has another two national parks.
Part of this seems to be that the nature of rural population growth has changed. From 1970 to 1996, rural areas grew by around 44% in the US as a whole. Rural growth in high-amenity areas was higher, but proportionally not that much higher given that rural areas were growing overall. But over the last several decades, there’s been almost zero (or less than zero depending on how you count) growth in rural areas overall. Growth rates in high-amenity rural areas are less than they used to be, but they’re still impressive when compared to the rest of the country.
Depending on how you decide to aggregate, you can get slightly different numbers here. If you aggregate by state, you get that western states are around 0.64 standard deviations above the national average.
It’s still somewhat of an open question in my mind how well the WRLURI actually measures the regulatory burdens to building housing.
I agree with your conclusion, and I'd just point out that in the penultimate section, the softening relationship between amenities and population growth is still perfectly consistent with high demand for amenities -- I just think (as you conclude) the elasticity of housing supply in the West has substantially shrunk, so that the high demand is no longer transmuted as smoothly into the growth of quantity in homes, but rather passes through into higher prices.
For an interesting case study on how mountain towns in the West have starkly turned against supply growth, check out the sad tale of Cle Elum, WA, on I-90 a couple hours east of Seattle in the Cascades, which has just declared bankruptcy in the face of an eight-figure settlement it owes for reneging on a development plan it struck in 2011.
TL;DR -- a developer had plans to build several hundred homes on a few hundred unincorporated acres adjoining the town; the town struck a bargain, annexing the land in order to impose some constraints on the developer, which the developer agreed to in exchange for fast-tracking permits; then in 2019, when they finally hit the gas pedal to build, a new city manager in Cle Elum reneged on the deal and used every last move in the NIMBY toolkit to try to stop the building and/or extract costly new concessions.
I think it's the same way all across the West, from California to Wyoming to Colorado, as incumbent owners seek to prevent new development nearby, essentially pulling up the ladder and saying "I got mine, pal. Take a hike!" to would-be new neighbors.
I was a landscape contractor in CA for 30 years. Up until about 2003 a 6 foot perimeter block wall was typically specified at 12"X12" footing, rebar every 36" (and poured) with a solid beam on the top course. Everything else was hollow. Permits were often unnecessary. In San Clemente, with the city flush with rising property tax values they hired more engineers and more inspectors to enforce the new engineering specs. Now a freestanding wall has to have a permit, a 24"x24" footing, rebar every 16", and all cores filled solid---theyre making freeway walls around gardens!! I understand this is for earthquake proofing but it's way overboard. So that's one cross section of why housing is so expensive in CA anyway.