

Construction Costs Rarely Fall
Not long ago we looked at construction productivity trends for the US and for countries around the world. We found that in the US, and in most other large, wealthy countries, construction productivity is stagnant or declining. Unlike manufacturing and agriculture, or the economy overall, which generally show improving productivity over time, in the field of construction we find that productivity tends to at best stay constant, and at worst decline over time.
Understanding trends in productivity — how much output we get for a given amount of input over time — is useful, but it’s also useful to look at other metrics of construction industry progress. One particularly salient measure is construction costs: how much money it takes to build a house or an office or an apartment building, and how those costs have changed over time. Cost is a good improvement metric because it directly tracks what we actually care about: we would like the costs of building housing, buildings, and infrastructure to fall and become more affordable, and we basically care about more abstract measures like productivity to the extent that they’re a proxy for costs.
Unsurprisingly, when we look at construction costs we see similar trends to what we saw with construction productivity; construction rarely gets any cheaper over time, and construction costs tend to rise at or above the level of overall inflation. As with productivity, we see this when we analyze the data at different levels of granularity, and we see it in both the U.S. and in countries around the world.
Construction cost indexes
Changes in construction cost are generally tracked using cost indexes, measures produced by various organizations which collect and analyze data to try and capture large-scale changes in construction cost. At a high level, there are two broad types of index: output indexes, and input indexes. Output indexes try to measure changes in the cost of finished buildings or infrastructure: how much it costs to build a house, or an office building, or a segment of road over time. Input indexes measure changes in the cost of some basket of construction inputs: the price of different construction tasks, or materials, or labor.
It’s not always straightforward to tell whether an index is an output index or an input index, because exactly how indexes are constructed can be somewhat opaque. An index that initially appears as if it’s an output index, because it apparently tracks changes in a particular type of construction (like new apartment buildings), may actually function more like an input index if it is constructed from price changes in inputs specific to that type of construction. All else being equal, I prefer output indexes to input indexes, because they should more closely track what we actually care about (the cost of finished buildings), and should be less subject to distortion. For instance, the invention of some great cost-saving construction method might not be reflected in an input index that simply tallies up the cost of 10 hours of labor, 100 pounds of steel, and 1 ton of cement (which is how many input indexes are constructed). But in practice output and input indexes tend to track each other quite closely.
Cost indexes are resistant to some of the measurement difficulties that dog productivity metrics, because they’re typically constructed to try and mirror the cost changes of actual buildings. For instance, we’ve previously seen that productivity metrics are dogged by problems of “changes in the output mix” — changes in the type of construction that takes place in a given geography or during a particular collection period can mask actual productivity trends. But the producers of cost indexes will often monitor trends in the construction marketplace, and modify how their index is constructed by weighing some items more heavily and other items less heavily to try and reflect that. We should thus expect them to be more resilient to changing output mix problems.
But in some cases cost indexes share the same measurement issues as productivity metrics. In particular, it can be difficult to adjust cost indexes for quality; a modern building might cost more per square foot, but be built to higher standards or otherwise have higher performance than an older building, which looking only at changes in costs won’t capture. Some indexes, such as the Census Bureau’s Constant Quality Index, try to account for quality changes, but most don’t. (This is in contrast to, say, the Bureau of Labor Statistics’s sector-specific inflation measures, which try to take into account quality changes when calculating inflation trends for things like TVs or new cars.) Indexes that do try to adjust for quality changes likely can’t account for it completely. These issues are somewhat mitigated by the fact that we care about costs as such, and it’s valuable to know how those costs are changing — i.e., even if some proportion of rising costs is due to increased standards and we are getting more bang for our buck, it’s still useful to know how construction costs are changing with respect to other prices. Nonetheless, we should keep this point about quality changes not always being reliably captured mind when we’re looking at cost trends.
To look at trends in U.S. construction costs, we’ll use the following indexes:
Output indexes
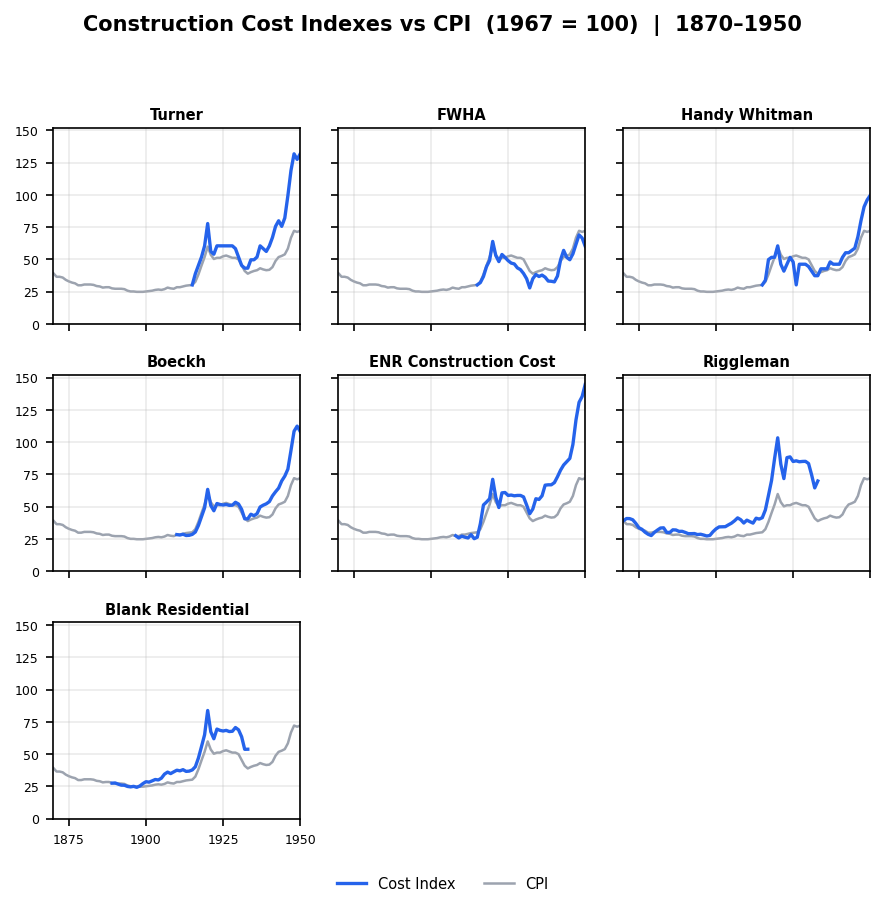
The Turner Building Cost Index — Produced by Turner Construction, one of the largest general contractors in the US, this index tracks the price of non-residential buildings by considering such factors as “labor rates and productivity, material prices, and the competitive condition of the marketplace.” This is one of the oldest continuously produced construction cost indexes, going all the way back to 1915.
The Census Bureau’s Single-Family Constant Quality Index — Produced by the US Census Bureau, this index tracks changes in the price of single-family homes, and goes back to 1964.
Handy-Whitman — Produced by Whitman Requardt and Associates, data in this index tracks the cost of building reinforced concrete, brick-lined utility buildings (though there are also other data for other types of buildings). The index is constructed by looking at the price of various inputs (materials, labor, equipment) for these types of buildings, but the relative proportions are adjusted to ensure that they reflect “current construction practice,” so I’m classifying this as an output index. I was able to get data for this index from 1915 to 2002.
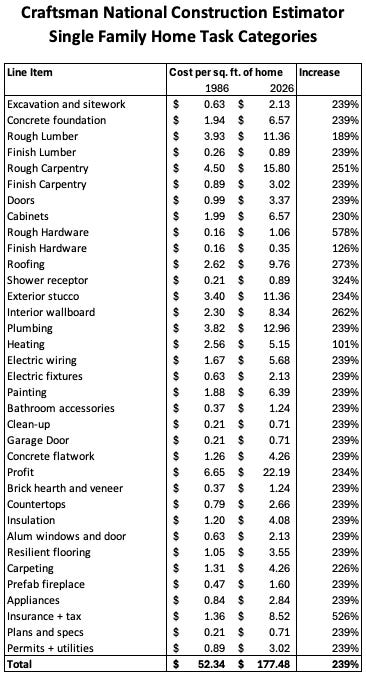
Craftsman single-family home costs — Craftsman’s National Construction Estimator, an estimating guide that has been published since the 1950s, includes an estimated cost per square foot to build a “typical” single-family home in the U.S. I was able to get these values going back to 1966.
The National Highway Construction Cost Index — Produced by the U.S. Federal Highway Association, this index tracks the cost of building highways over time, and is based on the price of winning bids for highway construction contracts. This public index goes back to 1915.
Input indexes
E.H. Boeckh Index — Produced by E.H. Boeckh and Associates, this index tracks the cost of a variety of different building types in cities around the U.S., based on “115 elements,” including labor costs, material costs, and tax and insurance elements. (I’m including this in the input indexes because I think it’s basically using the basket-of-inputs approach to construct costs, but depending on how they weighed these elements this might make more sense as an output index.) For many years this index was included in the Survey of Current Business produced by the U.S. Bureau of Economic Analysis. I look at this index for residential construction, for the years 1910 through 1991.
ENR Construction Cost Index — Produced by Engineering News-Record, this index tracks a basket of several different construction inputs — unskilled labor, steel, cement, and wood — the relative proportions of which are periodically adjusted. ENR also produces a virtually identical “Building Cost Index” that replaces unskilled labor with skilled labor. This index has been continuously produced since 1908.
RS Means Historical Cost Index — Produced by the RSMeans estimating company, this index tracks a basket of construction labor, materials and equipment costs. I was able to get data for this index going back to 1953.
Riggleman Index — Produced for an unpublished doctoral dissertation (by Dr. John R. Riggleman) in 1934, this index was made using several other indexes, such as the ENR construction cost index and the American Appraisal Company’s cost index for industrial buildings. This index is primarily useful because it goes back all the way to 1868.
Blank Residential Index — This is another composite index, which uses a weighted basket of construction inputs as well as the E.H. Boeckh index, to track the cost of residential construction. This index is useful because it goes back to 1889.
We’ll compare each of these indexes to the Consumer Price Index (CPI), a common measure of overall inflation. Because the Consumer Price Index only goes back to 1913, for earlier values we’ll use inflation conversion factors produced by Robert Sahr of Oregon State.
The graphs below show various cost indexes between 1870 and 1950.
And these graphs show cost indexes from 1950 to 2022.
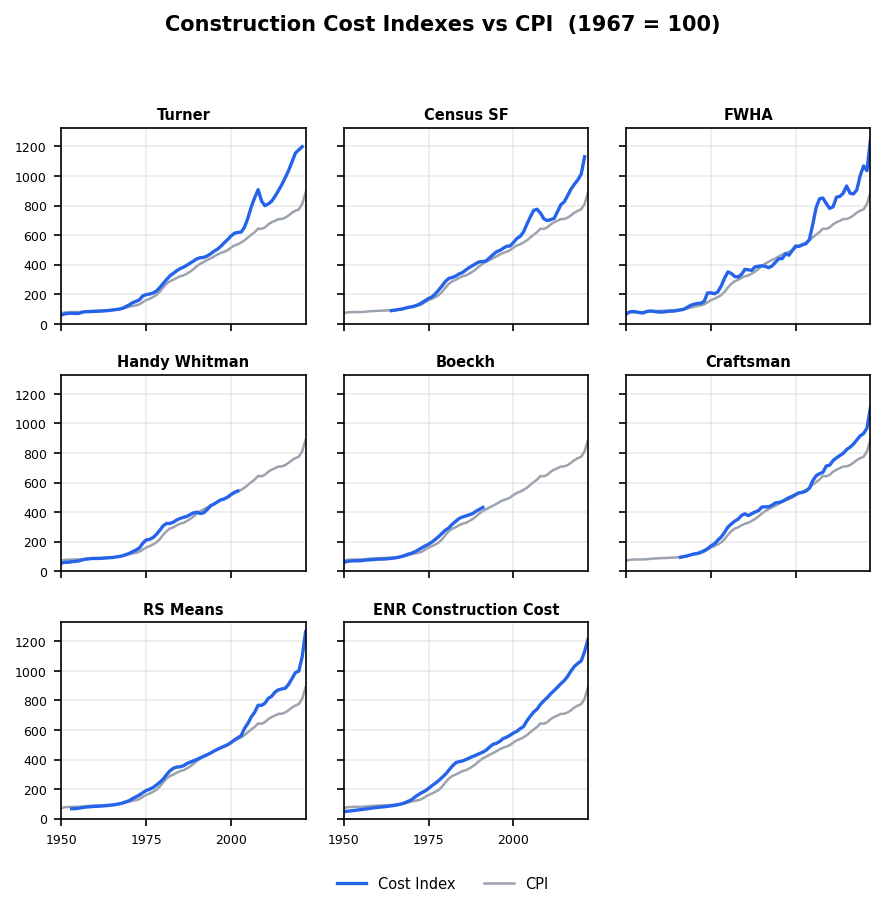
We can see that regardless of time period, and regardless of whether we’re looking at input indexes or output indexes, construction costs are rising roughly as fast as, or faster than, overall inflation. When we looked at productivity trends, we saw that since roughly the 1960s U.S. construction productivity has been stagnant or declining. Cost data suggests that the problem extends even further back, and that U.S. construction costs have virtually never fallen with respect to overall inflation.
These graphs give us a good large-scale view of cost trends for different indices, but it makes it hard to see cost trends over specific time periods. So let’s look at the average annual growth rate for each index over 10-year periods, minus the average growth rate of CPI for the same period. This will let us see how construction costs are changing with respect to inflation over specific periods: positive values mean construction costs are rising faster than inflation, negative means construction costs are rising slower than inflation.
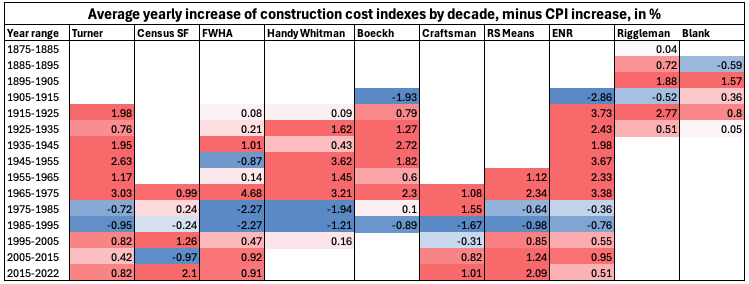
We see that in almost every period of time, construction costs are rising faster than overall inflation for virtually every cost index. The major exception is the period from 1975 to 1995, where most indexes show lower rates of increase or even declines against overall inflation. We also see that historic rates of cost increase seem to be as bad or worse than modern ones. For four of the five 10-year periods between 1915 and 1965, the Turner Cost index rose more than a percentage point faster than overall inflation, whereas for the periods from 1995 to 2025 it rose less than a percentage point.
Construction task costs
As with construction productivity, we can also look at more granular construction cost trends, by looking at how the costs of individual construction tasks have changed. We can do this using construction estimating guides, which provide estimates for the costs of various construction materials and tasks. By looking at the costs of the same, or similar tasks across various versions of estimating guides, we can see how the cost of those tasks are changing.
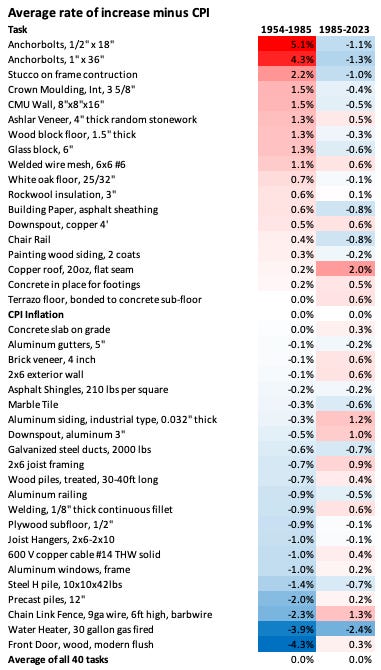
The chart below shows the cost of 40 different construction tasks taken from three different versions of the RSMeans estimating guide published in 1954, 1985, and 2023.
And this chart shows the cost of 20 different construction tasks taken from several different versions of the Craftsman National Construction Estimator published between 1967 and 2016.
We can see that cost changes in individual construction tasks aren’t uniform. Some have risen in cost faster than overall inflation; others more slowly. But on average, the cost of these construction tasks has risen at the level of overall inflation. So not only are buildings not getting any cheaper to produce on average, the cost of individual construction tasks isn’t falling either on average, at least for this collection of construction tasks.
There are issues with looking at changes in individual construction tasks. As we noted when we looked at construction productivity, all else being equal we might expect construction to improve by way of introducing new, improved processes, and thus looking at changes in older processes might not reveal very much. In the 19th century, nails got cheaper due to the introduction of new nailmaking processes - replacing hand-made nails with the cut nail process, and then the wire-nail process. If we looked only at improvements in hand-made nails, we might conclude that nails on the market hadn’t gotten any cheaper, even though what actually happened was that an older process had simply been replaced by a newer, better process. I’ve tried to avoid this by using construction tasks that I know are still in use, but this isn’t perfect. Unfortunately, this method may run into an adverse selection problem: picking tasks that appear in many versions of the estimating guide might deliberately select for ones that have been difficult to substitute. Nonetheless, it’s the best method we have for analyzing costs at the granular task level.
We can address this issue the same way we did when we looked at construction productivity, by looking at cost trends in broad categories of tasks. The chart below shows the cost per square foot for 32 categories of tasks required to build a single-family home from Craftsman’s National Construction Estimator. As we can see, task costs generally rise at roughly the same rate that overall home prices rise, and rarely change. (This is sort of mechanical outcome of the fact that task category prices are given as a percentage of overall costs, and for most task categories that percentage has changed little over time, but it’s nevertheless notable.)
Thus, at the level of construction tasks, we also see costs tending to rise at or above the level of overall inflation.
International construction costs
To see whether this trend is also observed internationally, we can look at similar construction cost indexes constructed for other countries. The cost indexes we’ll look at are below:
Eurostat Construction Producer Price Index for Residential Buildings — This cost index, produced by Eurostat for 36 different European countries, tracks the cost changes for residential buildings. (It’s not particularly clear to me how this was constructed: the website merely says that producer price indexes track “the average price development of all goods and related services resulting from that activity.”) For most countries this index goes back to 2000, but for some it goes all the way back to the 1950s.
The U.K.’s BIS construction output price index — This index tracks output prices for several different UK construction sectors (I used values from “All Construction”), going back to 1955. Because this index only goes up to 2011, I supplemented this with the similar Construction Output Price Index from the U.K.’s Office for National Statistics, which began in 2014.
Belgium’s ABEX index — This index tracks the price of building residences in Belgium. The Eurostat Producer Price Index includes data for Belgium, but it only goes back to 2000, whereas the ABEX index goes all the way back to 1914(!).
Japan’s Construction Cost Deflator — This index tracks price changes for several different sectors of Japanese construction, going back to 1960. I used the value for residential construction.
South Korea’s Construction Cost Index — This index tracks the change in construction costs for several different Korean construction sectors, going back to 2000. I used the index for housing construction.
Hong Kong’s Building Works Tender Price Index — Tracks the cost of new buildings in Hong Kong, based on contractor bids. Goes back to 1970.
Taiwan’s Construction Price Index — This index tracks the changes in construction costs in Taiwan, and is based on the prices of 115 different construction inputs. It goes back to 1991.
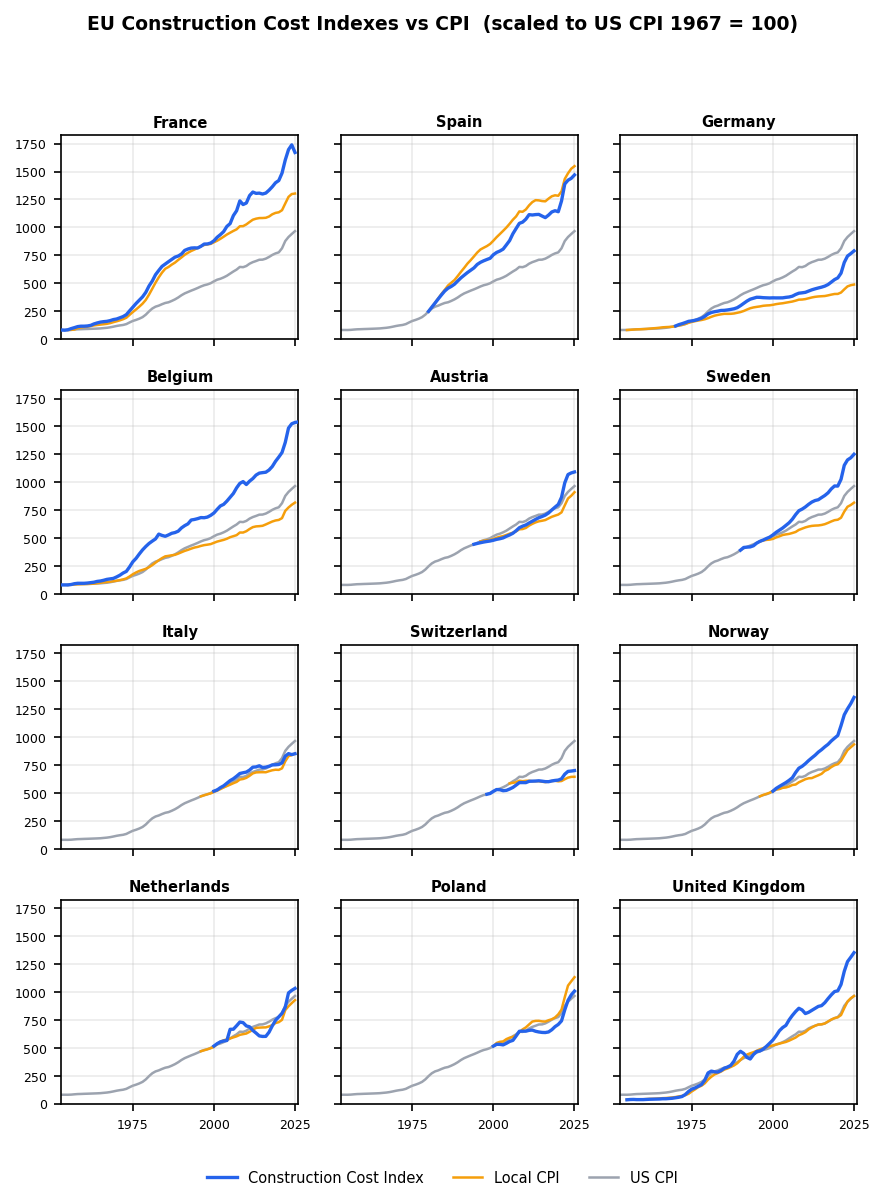
The graphs below show each of these indexes against the consumer price index for 12 major European countries, as well as the U.S. consumer price index.
And this graph shows construction cost trends for Asian countries.
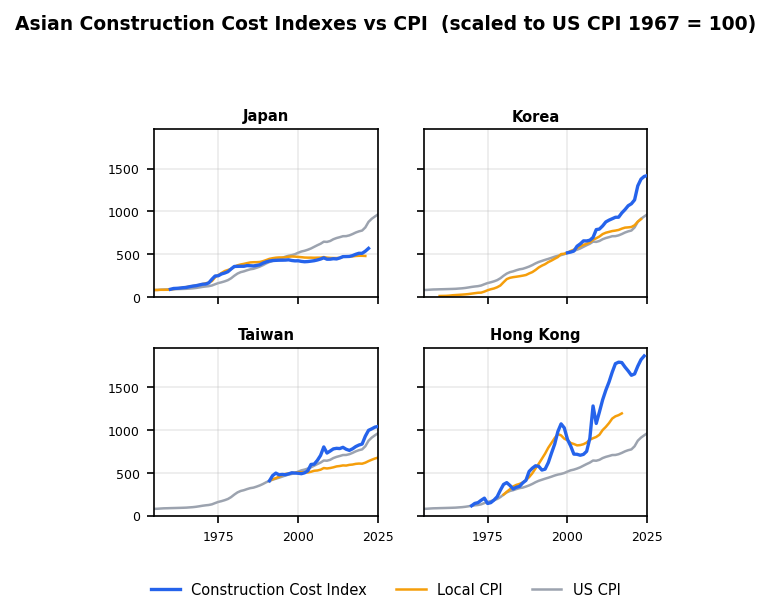
We see the same pattern that we saw with U.S. construction cost indexes: construction costs nearly always rise at, or faster than, the level of overall inflation in the country.
We can also see this if we look at changes in construction cost minus changes in consumer price index in 10-year buckets, as we did for U.S. construction costs. The chart below shows decade-by-decade changes in construction cost minus CPI for 41 different European and Asian countries (including lots of smaller and poorer countries that I didn’t include on the above graphs).
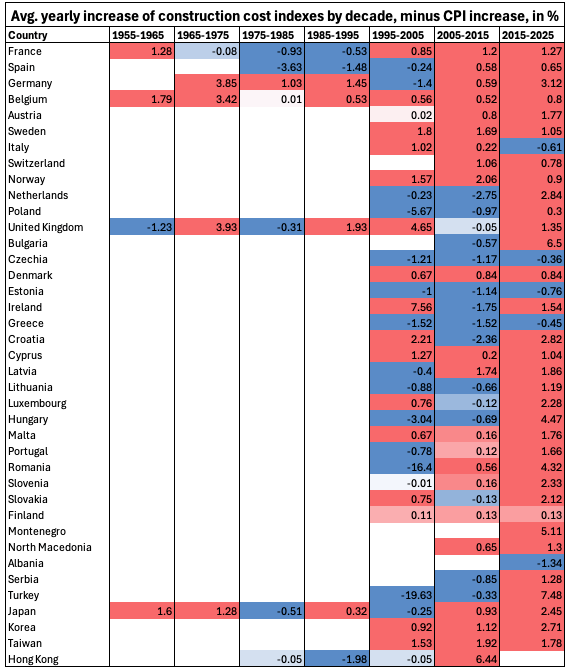
There’s somewhat more blue on this chart than in the US construction costs, but we can still see costs are, more often than not, rising faster than overall inflation.
Conclusion
When we looked at trends in construction productivity — how much construction output we get for a given amount of input — we saw that it’s mostly either relatively unchanging, or declining over time. We saw this in the U.S. using a variety of different metrics of varying granularity, and we saw it in most other wealthy countries. With construction costs — how much construction output we get for a given amount of currency — we see something similar. Construction costs tend to rise at, or above, the level of overall inflation, and it rarely (if ever) gets cheaper to build houses, offices, or other buildings. We see this in the U.S. with a variety of different metrics, and we see it in countries around the world. With stagnant construction productivity, we could date the problem as far back as roughly the 1960s. With construction costs, we can push the problem back even further: outside of a few windows of time, construction costs have virtually never fallen with respect to overall inflation.
this sounds like we should look at what's different in japan, sweden and switzerland, where the construction costs are at least rising slower than the CPI
Thank you for this. I'd be interested in an attempt to break down where the costs are coming from. Like, I expect the cost of labor is going up over time as it is in other industries (which is a good thing!). Given little to no automation in construction we should expect costs to rise right?
What about worldwide indices of materials costs? Surely these goods should fall in price since they are manufactured goods? And what about equipment costs?
One clarification: is the price of land included in these indices in some way? If so, increasing urbanization and rising land prices would drive cost increases.