

Stagnant Construction Productivity Is a Worldwide Problem
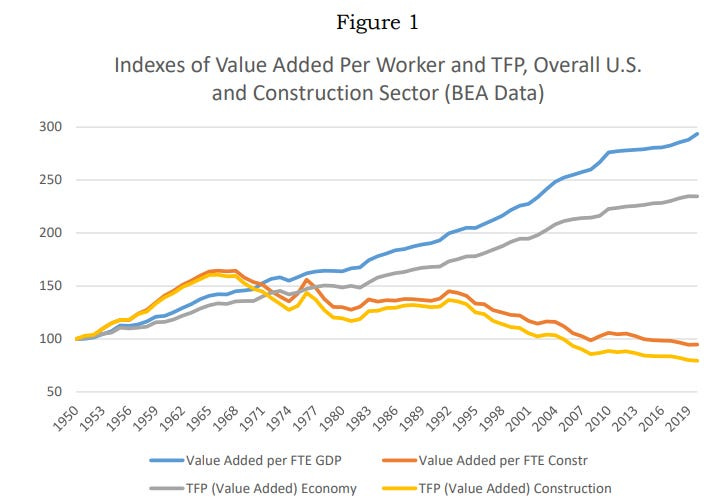
We’ve spent a lot of time examining the problem of construction productivity in the US — the fact that, across a variety of different metrics, construction never seems to get any more efficient (in terms of how much output you get for a given amount of input), or any cheaper. A paper I wrote about by Goolsbee and Syverson, for instance, titled “The Strange and Awful Path of Productivity in the US Construction Sector,” looked at a variety of different productivity metrics and found that they all show either flat or declining productivity. By contrast, other sectors (such as manufacturing), as well as the economy overall, tend to show increasing productivity.
Much of our investigations have been focused specifically on the issues of construction productivity in the US. But it’s also worth looking at construction productivity trends in other countries — if other countries are showing steadily improving construction productivity, that may give us ideas for ways to improve US construction productivity. If they’re not improving, by contrast, that suggests that US-specific things (such as various regulations) aren’t what’s holding American construction productivity back.
International construction productivity
To look at international construction productivity, we can use KLEMS databases, which aggregate productivity statistics for different industries in countries around the world. (KLEMS stands for capital (K), labor (L), energy (E), materials (M), and services (S).) These KLEMS datasets are a bit scattered and not amazingly well-maintained (I had to retrieve a lot of the data from archive.org), but by pulling them together we can assemble construction productivity datasets for dozens of different countries going back quite far:
The EU KLEMS dataset has productivity data for European nations, as well as a smattering of other countries. The current EU KLEMS release goes from 1995 to 2021, and in addition to European countries also includes the US, the UK, and Japan. Older EU KLEMS releases (I used the 2008 release) go all the way back to 1970, and in addition to the US, UK, and Japan, also include Korea, Canada, and Australia.
Asia KLEMS has productivity data for Korea, Japan, Taiwan, and India, going from 1980 to 2012.
LA KLEMS has productivity data for several latin american countries, going from 1990 to around 2019.
World KLEMS, in addition to links to the above datasets, also has links to Canada, Russia, and China KLEMS data.
To calculate productivity using this data — specifically, labor productivity, or the amount of output we get for a specific amount of labor — we can use the “chain linked gross value add” measure, VA_Q or VA_QI in the database. Gross value-add is the value of the outputs (in this case, the buildings and infrastructure produced) minus the value of “intermediate inputs” — materials, services, energy, and other things purchased from outside the sector in question. In other words, it’s the total value that the industry itself contributes. “Chain linked” is a way of adjusting for inflation, by calculating the growth rate for one year using the previous year’s prices, then “chaining” those growth rates together. To get sector productivity, we just divide chain linked gross value-add by a measure of total labor effort in that sector. For that labor effort variable, we’ll use H_EMP, which is the total number of hours worked by “engaged persons” — employees, business owners, and people who are self-employed.
For a few countries, we’ll need to calculate labor productivity slightly differently. India’s KLEMS data doesn’t include H_EMP, so we’ll use the number of employees instead. China’s KLEMS data doesn’t include VA_Q, but it does include the growth rate of labor productivity by industry, which provides the same information.
Putting all this together, the below chart shows construction labor productivity by country, for 45 different countries. Countries are color-coded by region, and labor productivity has been normalized to equal 100 in the first year for which there’s data.
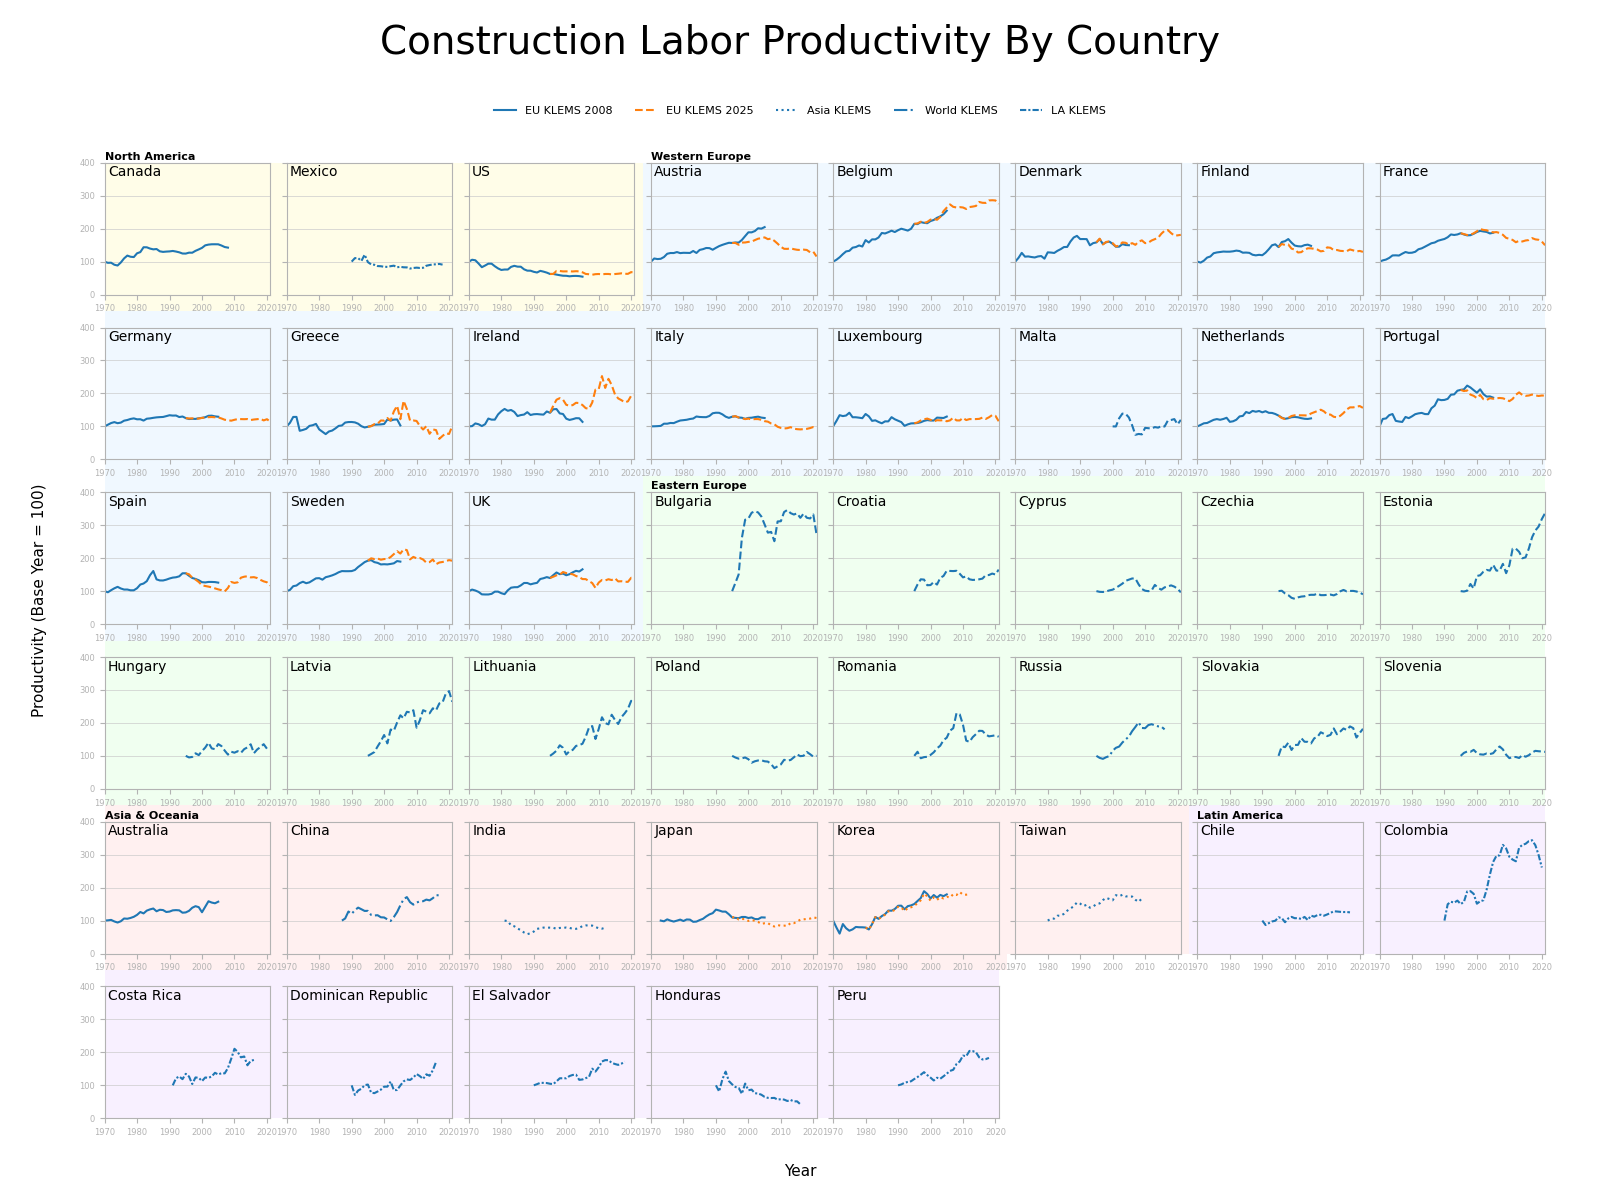
(Click to embiggen.)
Since this can be a little hard to parse, here’s a smaller graph showing productivity trends in 16 major countries. This figure also shows labor productivity in manufacturing (solid gray line), and across all industries (dotted gray line).
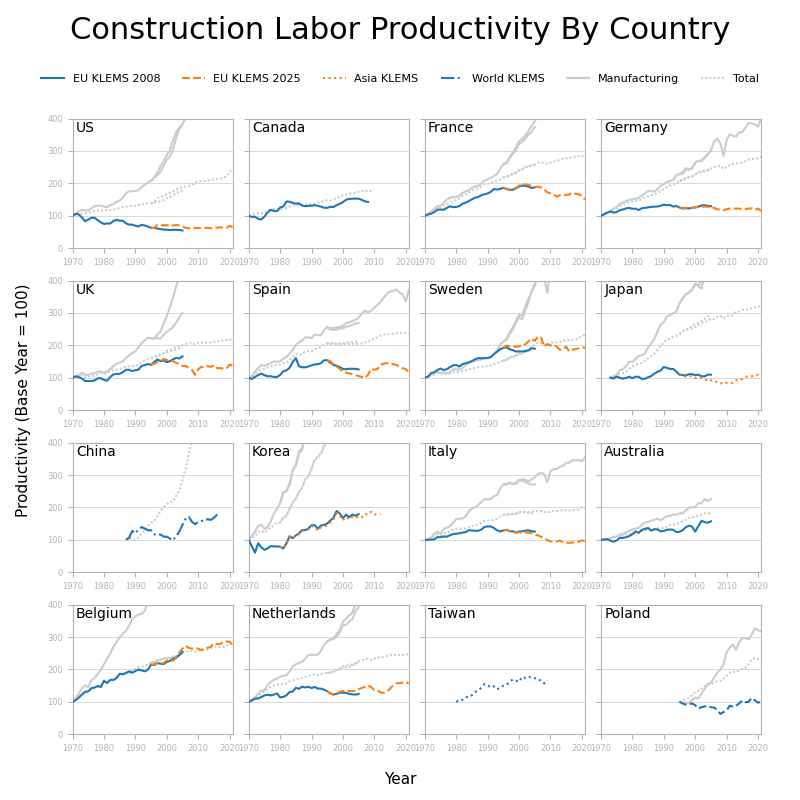
Let’s start by looking at the US. Per KLEMS data, the US had declining construction labor productivity since 1970, which started to flatten out around the mid-1990s. This exact pattern is a bit different from what other measures of US construction labor productivity show — Goolsbee and Syverson show productivity declining up through 2020, whereas Teicholz shows labor productivity that’s closer to flat since the 1960s — but it’s broadly consistent with them.
If we look at other countries, we can see that for the period from 1970 through the early 1990s, the US is an outlier in having declining construction productivity. From 1970 through 1995, US construction productivity declined by about 1.9% per year on average. For other countries where data goes back to the 70s (which is most of Western Europe, Japan, Korea, Australia, and Canada), only one other country shows an average decline over that same period (Greece), and its decline is much smaller. Most other countries show improving construction productivity of around 1-2% per year.
A 1-2% improvement in construction productivity isn’t amazing — as we can see in the figure above, it’s often much less than the rate of improvement in manufacturing, or in the economy overall — but it’s nevertheless a positive trend.
Since roughly the mid-1990s, however, the trends look somewhat different. The US arrested its construction productivity declines, and the industry’s productivity levels have stayed more or less flat. And many countries that previously were showing positive construction labor productivity growth — Germany, France, Italy, Spain, Austria, Japan, the UK — have since had flat or negative productivity growth. Other countries have maintained positive rates of productivity growth — Netherlands, Belgium, Denmark — but at lower levels than it was previously.
Starting in the 1990s (and earlier for some countries), we also have productivity data on a whole new swath of Asian, Eastern European, and South American countries. Many (but by no means all) of these countries — such as Latvia, Lithuania, Costa Rica, Peru — have shown steadily improving construction productivity over time. Typically it’s smaller and/or less wealthy countries that have shown these improvements.
Some of these countries (such as Taiwan) have shown a similar pattern as Western European countries, with construction labor productivity that improves for a while but then flattens out. The data for Taiwan and Korea (which both show this pattern) stops in 2012; I’d be interested to see what the trends since then have been.
Interestingly, despite the enormous amount of effort it put into infrastructure and building construction, and despite how repetitive much of it is, China does not appear to have particularly impressive growth in construction productivity. Productivity has risen, to be sure, but only at around a rate of 1.9% since 1987, and only around 1.4% since 1995. similar to the rates of growth seen in Western European countries in the 70s and 80s. Between 2007 and 2017, productivity growth is close to flat.1
Japan, the US’s former Asian rival, is similarly unimpressive, with nearly flat construction productivity since the 1970s.
Per this KLEMS data, the most impressive country in terms of productivity growth isn’t China, Japan, or Korea but Belgium, of all places. In the 1970s and 80s, Belgium had a construction productivity growth rate of greater than 3% annually, higher than anywhere else. And while most wealthy countries have had flat or marginal construction productivity improvements since the 1990s, Belgium has maintained a growth rate of around 1% per year. Belgium is also one of the only countries where the rate of productivity growth in construction is consistently similar to overall productivity growth.
It’s not clear to me if this is some sort of statistical or accounting artifact, or if Belgium has figured something out about construction that no one else seems to know. However, I’m somewhat inclined to think it’s the former. If you look at Belgium construction cost indexes, they seem to rise at roughly the same rate that US construction cost indexes do. And if you look at the actual cost builders are charging for new homes in Belgium, they appear to be slightly higher than US costs per unit area.
A note on the difficulty of measuring construction productivity
I’ve noted previously that in general I prefer cost as a measure of construction process improvement rather than productivity, and that I’m somewhat suspicious of these sorts of abstract measures of construction productivity. I’ve moderated this view somewhat, but it’s still true that care is required when trying to measure construction productivity, as it’s very easy for distortions to creep in. When I wrote about Goolsbee and Syverson’s paper on construction productivity, I noted that a very large fraction of the supposed decline in construction productivity is due to an unusually large deflator (used to adjust for inflation) used by the Bureau of Economic Analysis. Additionally, the United States’ Bureau of Labor Statistics sector-specific measures of construction productivity have shown implausibly large swings from year to year. The accounting required for sector-wide productivity estimates is just hard to do reliably.
An illustration of this is that a 2017 Mckinsey report on construction productivity, which uses the exact same KLEMS database that we used above, comes up with substantially different estimates of construction productivity growth.
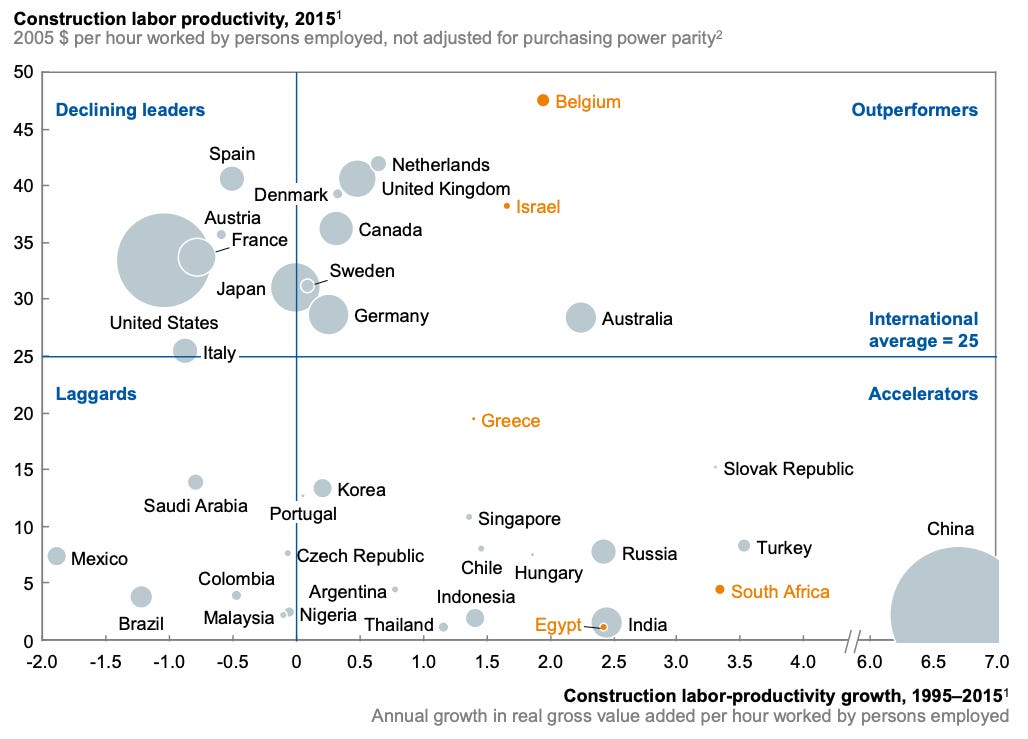
Per this graph, circa 2015 the UK had around 0.5% construction productivity growth since 1995, while per our calculations it would be slightly negative. Sweden and Germany similarly have positive construction productivity growth under this analysis, while per our calculations they were slightly negative. Both calculations show Belgium having positive productivity growth, but McKinsey has a growth rate that’s about twice as high as ours. And where we have a construction productivity growth rate for China of around 1.4-1.9% per year, McKinsey has it as closer to 7%.
What’s the source of this discrepancy? The chief culprit appears to be revisions in the KLEMS data over time. The Mckinsey report used KLEMS data circa 2017, while our post-1995 analysis above uses KLEMS data from 2025. This matters because KLEMS updates don’t merely include data for more recent years, they also revise previous data. Here, for instance, is UK construction productivity across several iterations of KLEMS data:
And here’re some revisions to the Swedish data overtime:
Between 2019 and 2024, Swedish construction productivity was revised upward substantially — changing it from a steady decline to merely mostly flat — whereas UK construction productivity was revised downward substantially.
My broader point is that it’s tricky to use these high-level, sector-wide productivity estimates: slightly different analysis choices (which deflator, measure of labor input, or dataset you use) can result in pretty different conclusions, so they should be used and interpreted with care. In particular, it’s somewhat suspicious that there’s a big change in productivity trends right around the point where we switch from an older (EU KLEMS 2008) to a newer (EU KLEMS 2025) dataset (though for many countries there’s good overlap between the two datasets).
Conclusion
Looking at this international productivity data, here are my main takeaways:
Per KLEMS data, many countries have historically shown construction labor productivity increases. From the 1970s through the 1990s, this was the norm for most Western European countries, as well as Korea and Taiwan.
The US is unusual for having declining construction labor productivity during this period.
Since roughly the 1990s, some (but not all) Eastern European countries, some (but not all) Latin American countries, and China have seen substantial construction labor productivity increases. A few Western European countries — Ireland, Denmark, the Netherlands — have seen more modest increases since the mid-1990s. But most Western European countries, along with Japan and Korea, have had flat or declining labor productivity growth since the 1990s.
The recent US trend in labor productivity — it staying roughly flat — is fairly consistent with trends in other large, wealthy countries. This includes countries whose construction practices the US is often encouraged to emulate. Sweden, for instance, is often praised for its high adoption of prefabricated construction, but since the 1990s Sweden has had roughly flat construction labor productivity, even as it has made more extensive use of prefabrication. Japan similarly makes wider use of prefabrication than the US does, and Japan has proved willing to experiment with technologies like automated skyscraper construction, but has seen virtually no construction productivity improvement since the 1970s. China is held up as an example of an infrastructure-focused nation that the US should emulate, but its construction productivity gains, while positive, don’t appear to be particularly impressive.
The most impressive country for construction productivity is Belgium — it stands alone as a rich country that has had sustained, high levels of construction productivity growth. However, it’s not clear if these are real improvements or some sort of statistical or accounting artifact. Cost data does not appear to indicate that Belgium is building things massively more cheaply than elsewhere. (If you know anything about construction productivity in Belgium, email me.)
All this must be taken with a large grain of salt, because this sort of productivity accounting is hard to do accurately.
Overall, my take when looking at this data is that stagnant construction productivity is an extremely widespread problem. The trends we see in the US — flat or declining construction productivity — are also what we see in other large, wealthy countries over the past 30 years. Most countries that achieved construction productivity growth at one time haven’t maintained it. The countries that currently show improving productivity tend to be small (Ireland, Denmark, Estonia), poor (Colombia, Peru), or both. And construction productivity improvements in these countries tend to severely lag improvements in manufacturing, or what’s observed in the economy overall. Even sustained, large-scale building programs (such as China’s) or widely adopted factory-based construction (such as Sweden’s) don’t appear to have changed this.
This isn’t to say that there’s nothing the US has to learn from other countries. For one, it’s worth understanding what specifically was going on towards the end of the 20th century when so many countries had rising construction productivity, often at or above the levels of productivity improvements in their overall economies. It’s also worth investigating what, specifically, is going on in places like Belgium and Estonia; I’m not amazingly confident there will be lessons that are broadly applicable, but I’m not so pessimistic that I don’t think it’s worth probing further.
The above data also only considers changes in construction productivity, and doesn’t have anything to say about absolute levels, and it seems obvious to me that, in many cases, US construction practices lag behind European ones for things like transit construction. The US has a lot to learn from other countries for how to catch up to the efficient frontier, especially for certain types of construction (ie: transit) and in certain places in the country (ie: expensive coastal metros). But this data suggests that driving that frontier forward is a much thornier problem.
More charitably, there’s a productivity decline starting around 2007, likely as a result of the global financial crisis’ effect on construction, followed by an increase of around 2.2% per year.
We have found the industry extremely fragmented and competitive. We teach project teams how to apply Lean Construction approaches with shared risk & reward and how to work together rather than in a linear process. (Contractors become part of the design process - See Lean Construction Institute). Improvements vary but are usually around the 10 - 15% time & cost improvement. It should also be noted that construction processes based on various materials and tools has not really advanced technically. Modular and Industrial methods & materials have been explored for decades but still haven't crossed the chasm.
Is it possible that there is a global ceiling on productivity within the construction industry, and the US was just the first one to hit it?
The other nations with lower levels of productivity keep increasing productivity by copying technologies, skills, and techniques from other nations until they eventually bump up against the same ceiling.
By the way, I am not implying that new technologies or processes cannot break through that ceiling in the future. Just that it has not happened so far.