

How Accurate Are Learning Curves?
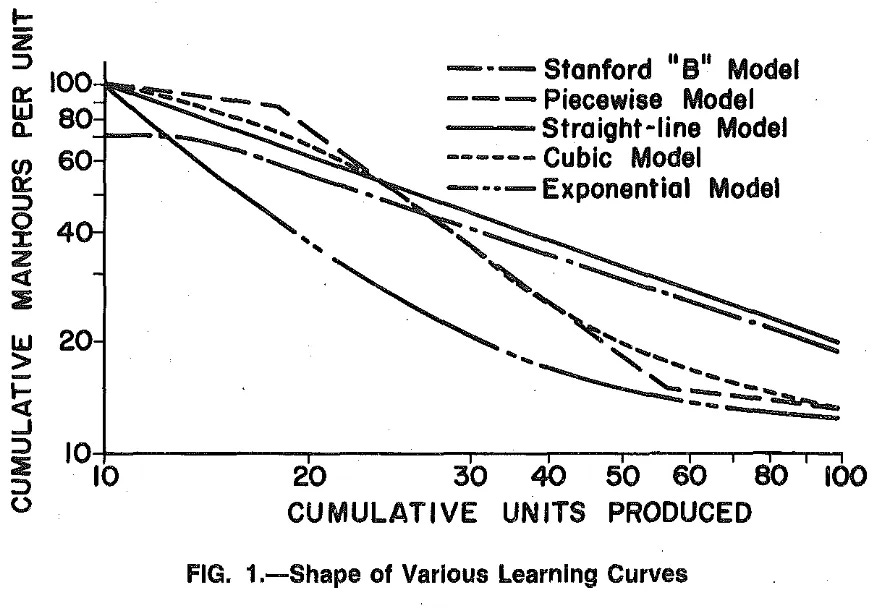
We’ve talked several times on this substack (as well as in my book), about the learning curve, the observation that costs of a produced good tend to fall by some constant proportion for every cumulative doubling of production volume: go from 100 to 200 units, costs might fall by 15%, go from 200 to 400, another 15%, and so on. Also known as “Wright’s Law” or the experience curve1, the learning curve can be described by the equation y = ax^-b, where y is the cost for the xth unit, a is the cost for the 1st unit, x is the cumulative production volume, and b is the learning exponent, which determines the rate at which costs fall. The hallmark of this sort of formula is that it makes a straight line on a log-log plot. Here, for instance, is the learning curve for transistors:
An obvious feature of the traditional learning model is that it uses a single learning rate: the amount that costs decrease every doubling stays the same. But a new paper published in the journal Advances in Applied Energy, “Variability of technology learning rates,” argues that modeling cost declines with a single learning rate isn’t really accurate. Rather, the authors propose that learning rates actually change frequently over time, and a model that can accommodate this will better predict future costs than the traditional Wright’s Law formulation.
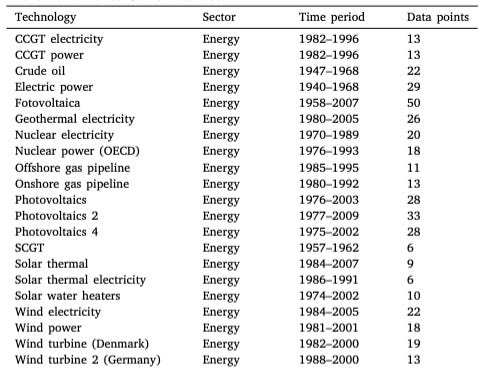
To show this, the paper uses 87 learning curve datasets from the Performance Curve Database, which has data on cost and production volume for a variety of different products and technologies across several different industries. Most of the datasets (50) are for different chemicals, with the second largest category (21) being for energy technologies.
The paper starts by looking at how consistent learning rates are. They split each dataset into two halves, and calculate the learning rate for each half of the data. They find that there’s not much correlation between earlier and later learning rates:
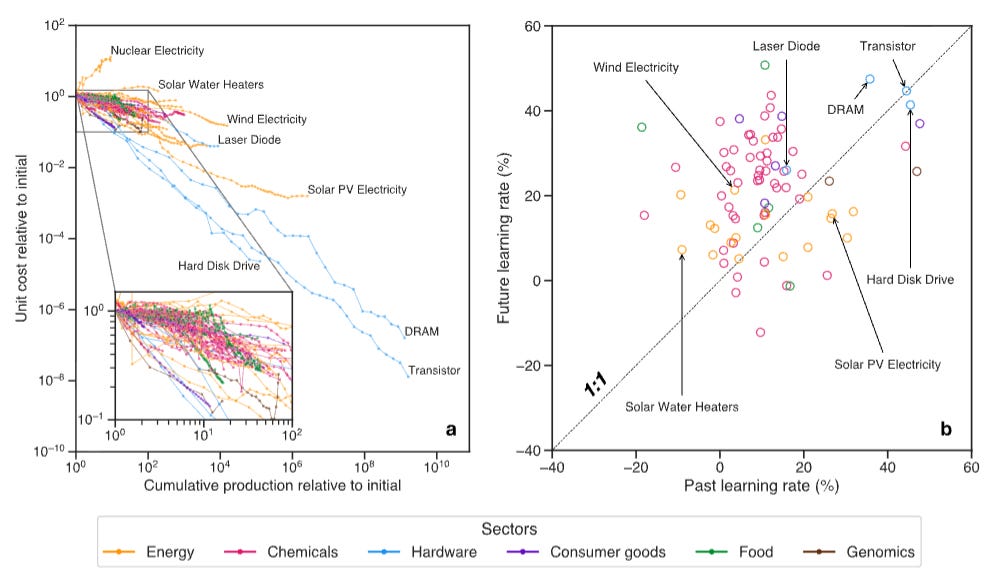
The authors also note that you get similarly low correlations if you just look at the half of the datasets with the largest number of datapoints. So the low correlation between early-production and late-production learning rates doesn’t appear to be an artifact of some datasets having just a few datapoints.
I downloaded the data the authors used from the Performance Curve Database, and was able to pretty easily replicate both of these findings. There’s not a perfect match between the learning rates I calculated and what the paper authors calculated because I did a much simpler analysis, but it’s essentially the same result that there’s little correlation between past and future learning rates.
You can also get a qualitative sense of this just by looking at graphed learning curve data. Here’s all 87 learning curves, graphed. You can see that lots of these datasets aren’t following any sort of straight line, and are full of what the paper calls “break points”: places where the learning rate changes.
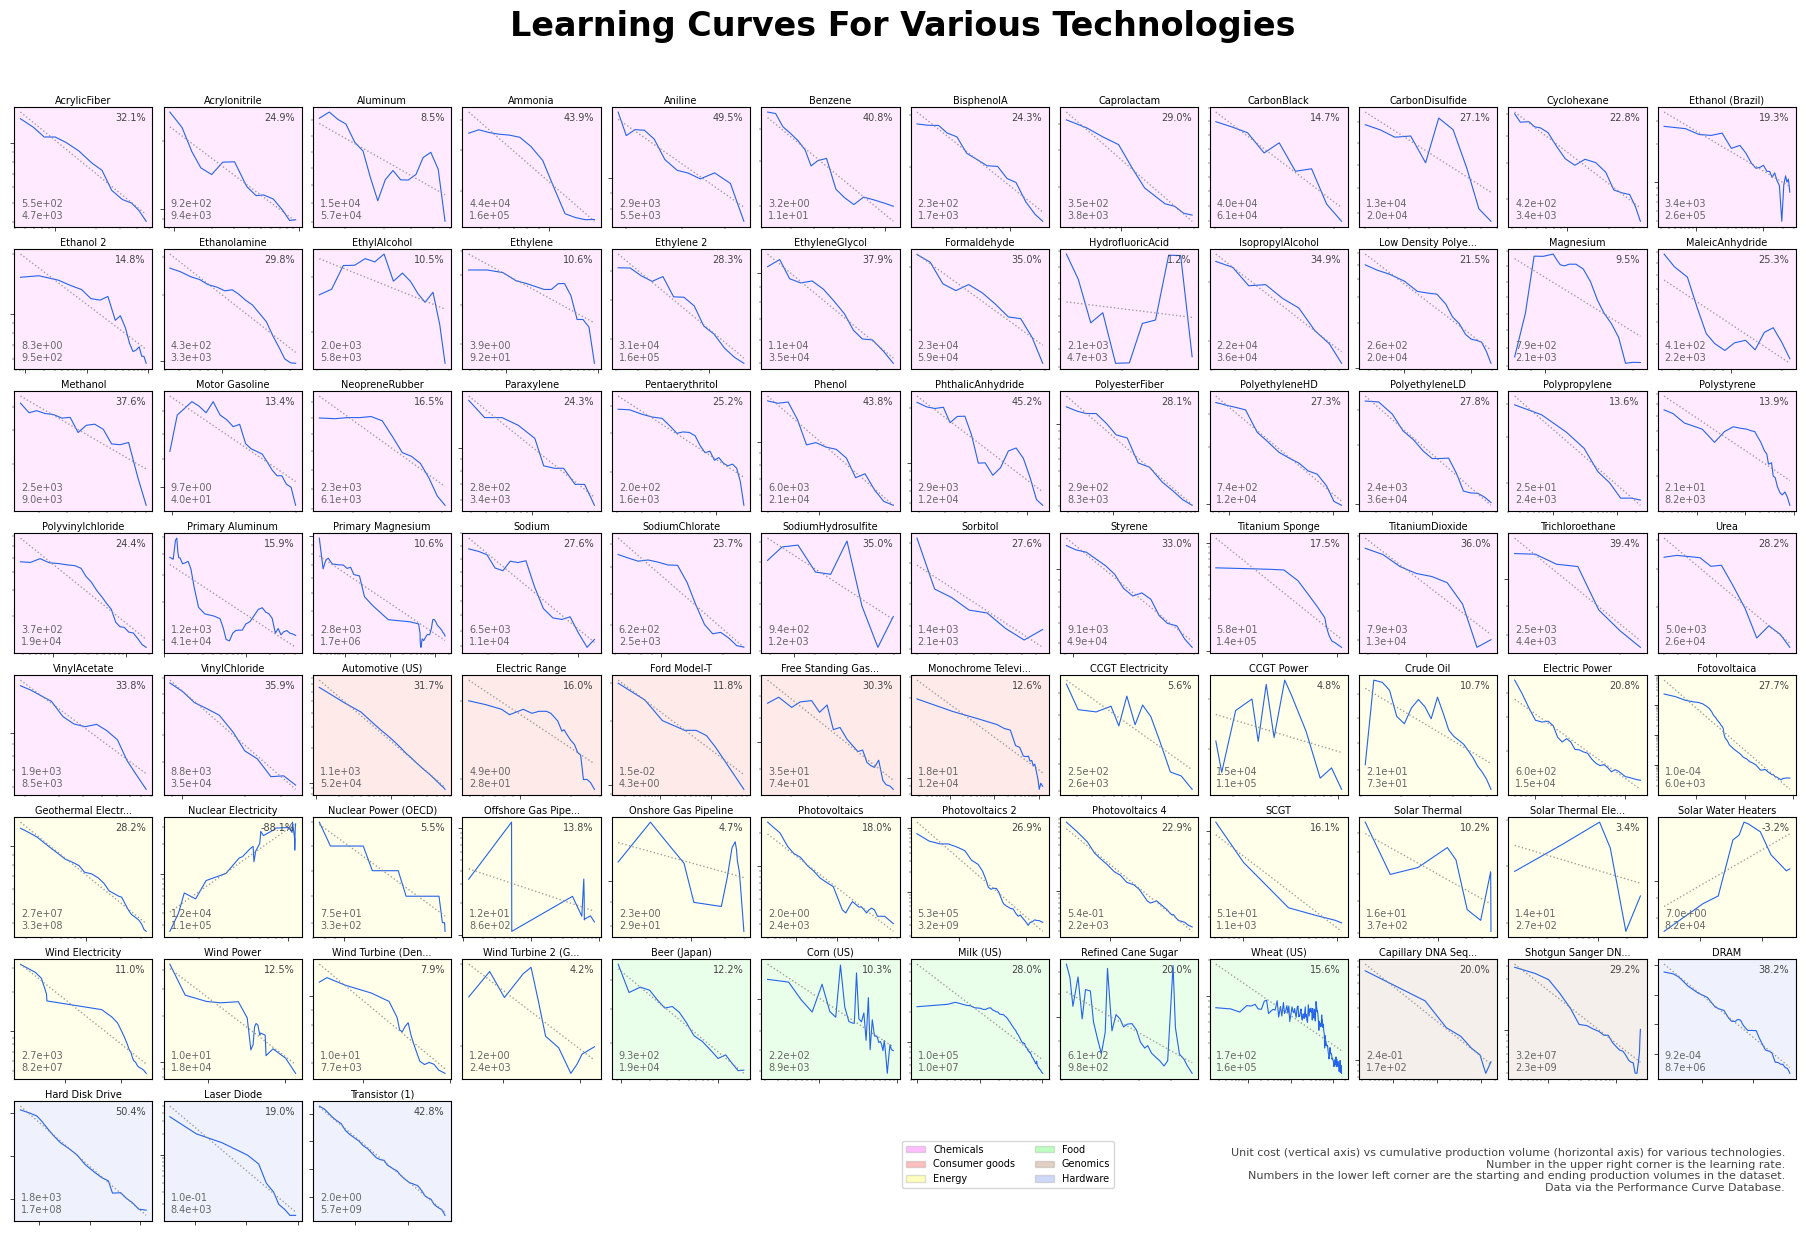
(Click to embiggen.)
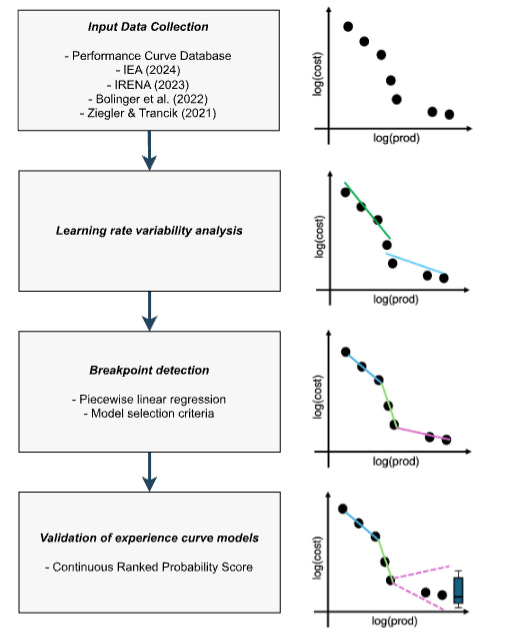
The authors propose an alternative model to the simple, one-learning rate formulation of the learning curve. They first do a piecewise linear regression (using multiple lines, each one fitting a portion of the data) on each dataset, using some math to balance the complexity (how many different lines you use) vs the accuracy (how closely the line fits the data) of the model. They use these regressions to construct probability distributions for possible learning rates and for the spacing between break points. They then use these probability distributions to make production cost forecasts for each technology. Starting with the most recent observed learning rate, you sample a production volume at which the next breakpoint will occur. The current learning rate is extended to that breakpoint, after which you sample both a new learning rate and another breakpoint location.
Unlike Wright’s Law (which assumes learning rates are constant), this forecasting method assumes that learning rates change frequently, in a probabilistic fashion. The authors find that this forecasting method somewhat more accurately predicts future production costs than the simpler Wright’s Law model. For 30 of the technologies, the author’s piecewise linear model forecasts future costs better. For 36 technologies the forecasts are about equal, and for 21 Wright’s Law does better. But relative performance varies by category of technology. For energy technologies, about half are better predicted by the piecewise model, and about half are equally well-predicted by the two models. For consumer goods and genomics, the two models are also roughly equally accurate. And for what the paper calls “hardware” – transistors, laser diodes, DRAM, and hard drives — Wright’s Law does better.
Interpreting this paper
There’re some interesting findings in this paper, but I think it’s useful to put it into context.
First, as the authors note, it’s long been known that learning curves will often deviate from a nice straight line on a log-log graph. One of the earliest systematic studies of the learning curve, “An Economic Study of the Military Airframe Industry” (published in 1957), notes that “[a]lthough the mathematical equation of the Learning Curve predicts a uniform reduction in the direct man-hours requirements per pound of airframe with each doubling of the cumulative units, there is often a tendency for the data to deviate from the theoretical line,” and goes on to describe the structure of various deviations and possible explanations for them. Likewise, “Perspectives on Experience,” an influential book on learning curves published by Boston Consulting Group (BCG) in 1970 (and which is the source for much of the Performance Curve Database data), notes that “price” (what consumers pay, and what learning curve datasets often track) often deviates from predicted learning curve trends. The BCG researchers suggest that this is because learning curves predict costs, not prices, and there will be various reasons that prices might diverge from costs: a manufacturer pricing below costs early in a production run, a monopolist pricing above costs when market power allows them to, and so on. In a 1979 review of learning curve research, Louis Yelle notes that a variety of different curve shapes have been proposed, due to the fact that “the linear model does not always provide the best fit in all situations.” Baloff’s studies in the 1960s and 70s also noted that the smooth learning curve line can be disrupted by various factors.
But I’m not aware of earlier work that takes a systematic look at the deviations across a large number of different learning curves like this paper does. The most interesting finding in this paper, to me, is the observation that there’s apparently little correlation between past and future learning rates. This doesn’t completely overturn the idea of learning curves — even without constant learning rates, you still have costs falling as a diminishing returns function of cumulative production volume, which to me is the most important idea behind learning curves. But it does suggest that a simple, straight-line extrapolation will do a worse job forecasting future production costs than I previously thought. Deviations from the predicted, straight-line curve are apparently more the rule than the exception.
I’m somewhat less enthusiastic about the paper’s suggested alternative forecasting method of probabilistically selecting learning curve parameters, at least in its current form. I think the idea of drawing from a distribution of possible learning rates and distances to the next change in learning rate is interesting, but the proposed model doesn’t seem all that much better than the simpler, single learning rate model. The net advantage of the piecewise model — the number of technologies where piecewise does better, minus the number of technologies where Wright’s Law does better — is only 9 technologies out of the 87 analyzed.
A lot of research has gone into turning learning curves into more of a predictive tool, so that economists and manufacturers can accurately predict what the learning rate for some particular technology will be (or at the very least, understand the cause of deviations from the curve). This research tends to take an “inside view” of learning curves – that is, it tries to predict learning rates based on specific features of the technology or the industry that produces it, or on specific events that impinge on production. Examples of this include James McNerney et al’s 2011 paper, “The Role of Design Complexity in Technology Improvement,” which proposes a model of learning rates based on the degree of interconnectedness of the technological components in the product, and Malhotra and Schmidt’s 2020 paper, “Accelerating Low-Carbon Innovation,” which proposes a learning curve taxonomy based on a product’s complexity and its mass-producibility.
This paper, by contrast, takes more of an outside view. Instead of trying to predict learning rates based on specific features of the technology or on specific events which might trigger a change, it simply assumes that a learning curve will behave like other, similar learning curves, that learning rates will change every so often in a probabilistic fashion. I like a lot of the inside-view efforts to try and understand what drives learning curve rates. But I’m a big fan of outside view-style reasoning. So even though in practice this sort of outside view model didn’t seem to be an amazing advance over the simpler Wright’s Law model, it nevertheless seems potentially fruitful to think about learning curves along these lines.
Some people make distinctions between some of these terms, but they broadly describe the same basic phenomenon.
Thank you for the close reading of this paper — it is much-talked-about and not obvious on a skim, making it a perfect choice. Learning curves are such a tantalizing phenomenon: of central importance, seemingly the product of fundamental regularities (I’m partial to the interconnectedness angle), but with N so small and the range of interacting dynamics fairly numerous that we find it vexingly difficult to isolate clear evidence of causality.
Thank you also for The Origins of Efficiency, which I enjoyed very much.
We see some items with increasing unit costs with the increase in production volume. For items not including nuclear energy, it seems likely that those increases are due to increases in the costs of inputs, perhaps due to constricted supply, which are later alleviated.
In the case of nuclear power, it seems plausible that the safety costs and fuel life-cycle costs increased as we learned more about the technology.
On second thought - safety/pollution costs might apply for other items as well. Also, there is an implied time variable which could be interesting.
Thoughts?
edit: On second though => On second thought