

Why Is Homeowners Insurance Getting So Expensive?
The recent Los Angeles fires have highlighted the rising costs of homeowners insurance in the US. Between 2020 and 2023, US homeowners insurance premiums rose 33% on average. In some places, insurers are simply cancelling policies entirely, due to a combination of rising insurance costs and state regulations that limit how much insurers can raise rates. This has driven many customers into state-backed insurers of last resort — the number of such policies has doubled since 2018, raising liabilities so much that in many cases it's unclear how the states will fund losses in the event of a large catastrophe. This situation is currently playing out in the aftermath of the LA fires, where the state-backed insurer is estimated to face $8 billion in losses against $377 million in available funding.

Rising insurance costs have led some folks to worry that the world is becoming “uninsurable”: that is, that the risk of disaster is making homeowners insurance (and thus home ownership) either increasingly unaffordable or out of reach entirely.
It’s easy to understand why insurance in some places, like wildfire-prone areas, is getting expensive or unavailable. But the broader trend of rising insurance costs can be observed in essentially every state, and it’s harder to explain. Most potential explanations don’t seem to be sufficient to explain the increase, either because the impact is too small, or because the cause wouldn’t apply country-wide. After diving into the data on homeowners insurance spending and losses, I came up with few smoking guns.
Homeowners insurance costs over time
To understand trends in homeowners insurance, we can use annual profitability reports from the National Association of Insurance Commissioners, which tracks premiums, losses, and overall profits for different types of insurance on a state-by-state basis going back to the 1970s. Here’s US homeowners insurance premiums per capita (total insurance premiums paid divided by population), in 2022 dollars.
We can see that even after adjusting for inflation and population, homeowners insurance costs are steadily rising over time; between the 1980s and today, per-capita premiums more than doubled, with most of the increase coming after 2000.
Most folks reach for climate change-fueled disasters as the explanation, but let's first look at other potential factors. One obvious one is simply an increasing number of homes. Over time, household size in the US has shrunk, meaning that the number of homes has risen faster than the overall population. The more houses per capita, the higher homeowners insurance per capita will be. Similarly, homeownership rates have increased since the mid-1980s, though the increase is very slight and isn’t monotonic. Another factor is increasing home size: new homes are generally getting larger over time (though this trend reversed around 2015). Larger, more expensive homes will obviously be more expensive to insure. And a final factor is construction costs, which have often risen faster than overall inflation. The more expensive it is to repair a home, the higher the cost to insure it.
Here’s per-capita insurance costs adjusted for changes in home size, number of homes/homeownership rate, and construction cost inflation.
Adjusting for the number of homes and home size explains about 15% of the increase, and construction cost explains another 33%; together, they explain about half the cost increase.1 However, only since around 2016 can increased construction costs explain a large chunk of the cost increase. I suspect a lot of what’s happening is that lots of homeowners insurance policies haven’t adjusted their coverage (and premiums) upward to account for the fact that construction costs rose precipitously over the last several years. My SWAG is that the actual fraction of homeowners insurance cost increase that number of homes, home size, and construction cost can explain is closer to 25% than 50%.
Another possible factor is rising profits: maybe insurers are simply pocketing the increased premiums. Here’s US homeowners insurance profitability over time.
There is a slight trend upward (more visible if you use a moving average)2, but this still doesn’t explain more than a tiny sliver of the increase. Homeowners insurance profitability is extremely low, and in any given year the industry is very likely to lose money. Between 1977 and 2022, US homeowners insurance profits were greater than 10% in only 5 years, and nationwide annual profits have never exceeded 15%. The average annual profitability for the industry is less than 1% (and depending on how you calculate it, it may actually be negative).3 In any given year, insurers lose money on homeowners insurance in about 1/3rd of the states.
(This New York Times article highlights a scary-looking chart that implies that more and more states are unprofitable for homeowners insurance. But if you look at the larger timeline you can see that the number of unprofitable states is well within historical trends, and that, despite the recent increase, that number is actually close to historical lows.)
More generally, the loss ratio (the fraction of premiums paid out to claims) of homeowners insurance nationwide has been relatively stable over time. Roughly the same fraction of premiums are paid out today as they were in the 1970s. So whatever is causing insurance costs to go up, it seems to be by way of increased losses driving up premiums.
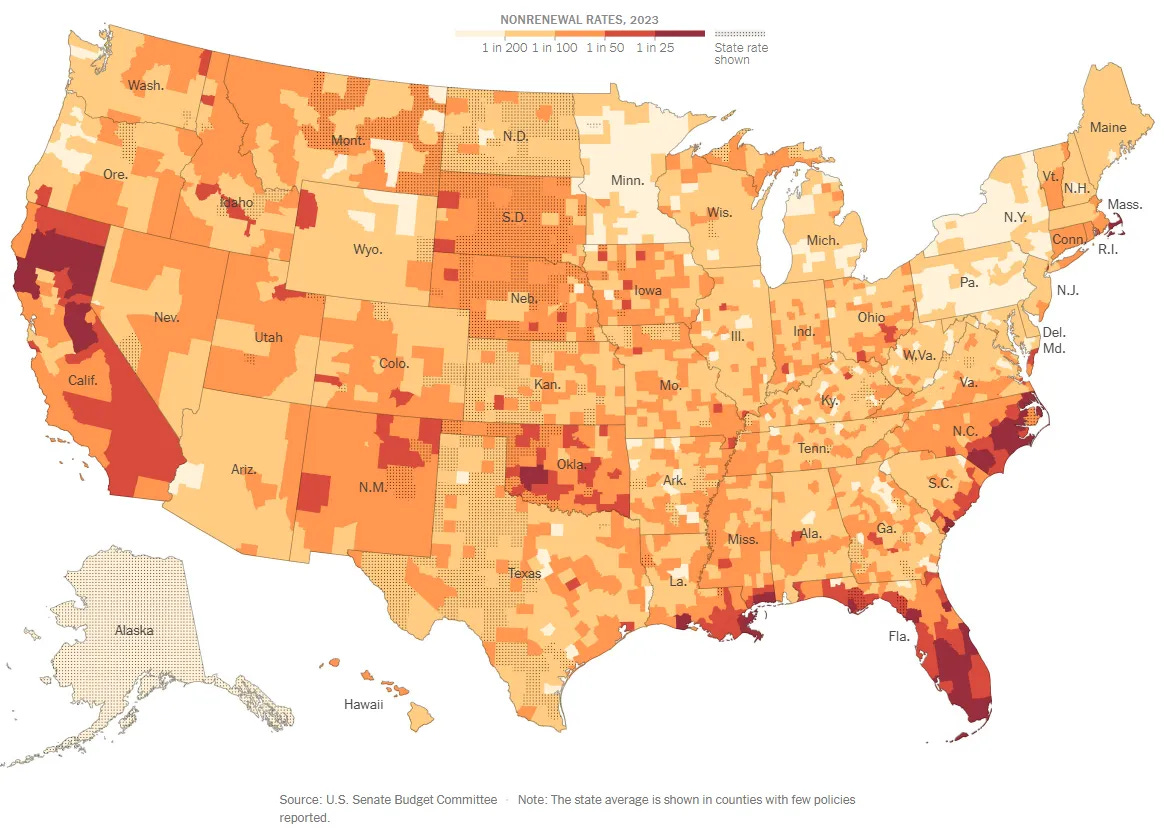
Another possible explanation is geographic population changes. If people are disproportionately moving to risk-prone areas where insurance is more expensive (such as fire-prone California or the hurricane-prone southeast), that could show up as a steady rise in insurance costs nationwide, even if no particular place is getting more expensive to insure. Here’s state-by-state insurance costs over time:
We do see a huge increase in homeowners insurance costs in Florida (though this is apparently driven by fraud and litigation as much as it is hurricane risk), but we also see that the increase in insurance costs is very broad. Roughly 90% of states have seen their per capita homeowners insurance cost nearly double or more in real terms since 1980, and the average rate of increase in the South is only slightly higher than the nationwide average. The region with the highest rate of insurance cost increase isn’t the South, but the Midwest, which has fallen as a percentage of the entire US population over time.

There are more sophisticated analyses you could do here: using a more accurate count of homes that includes vacation homes and not just owner-occupied homes, looking at state-by-state number of homes and home size increases, using task-based construction cost inflation instead of just the high-level Census index, looking at more granular population shifts, and so on. But I would be somewhat surprised if these changed the overall conclusion here. Homeowners insurance costs have risen nationwide for the past several decades, and things like regional population changes, increasing home size, rising construction costs, and insurers profits only appear to explain a portion of the increase.
Climate change and insurance costs
This seems to leave climate change as the most obvious explanation for the remaining cost increase. It’s certainly what most articles on the subject conclude. And there’s plenty of evidence pointing to climate-driven natural disasters as a driver of rising insurance costs. The National Oceanic and Atmospheric Administration (NOAA) tracks major weather-related disasters over time, and finds that they’ve steadily increased since the 1980s. From 1984 to 2023, the average annual cost of major disasters (those costing $1 billion or more) rose from less than $20 billion to nearly $150 billion.4 Most of this increase comes from severe, non-hurricane thunderstorms causing tornadoes, hail, high winds, etc.
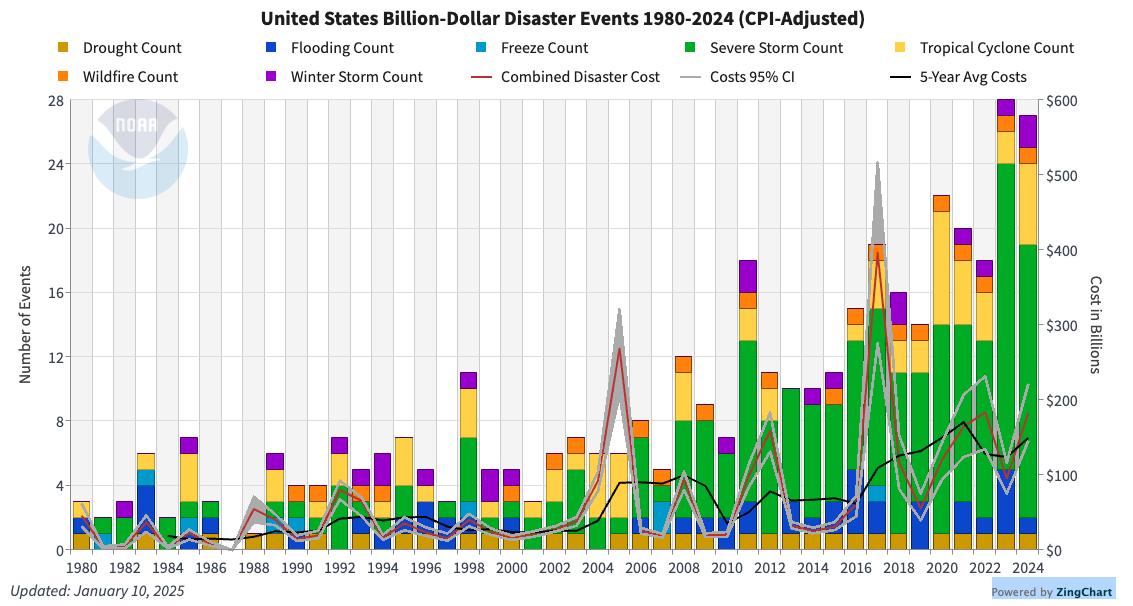
We see a somewhat similar trend if we look at the magnitude of homeowners insurance losses on a state-by-state level over time. As noted earlier, in any given year insurers will lose money on homeowners insurance in a large number of states. The number of states where losses exceed $1 billion in a given year has crept up over time (though this trend is less pronounced for $500 million losses, and almost nonexistent for $100 million losses).
This tells us that losses from disasters are getting more expensive, but it still doesn’t tell us what, specifically, is driving them. We ruled out several explanations above (ie: it’s mostly not because homes are so much larger today), but there are still many factors that could be at work.
The most obvious one is that disasters are getting more frequent and/or more destructive. But as far as I can tell, this is only partially true. NOAA notes hurricane frequency or severity doesn’t seem to be increasing [emphasis mine]:
There is no strong evidence of century-scale increasing trends in US landfalling hurricanes or major hurricanes. Similarly for Atlantic basin-wide hurricane frequency (after adjusting for changing observing capabilities over time), there is not strong evidence for an increase since the late 1800s in hurricanes, major hurricanes, or the proportion of hurricanes that reach major hurricane intensity.
Climate policy nonprofit Climate Central likewise notes that severe thunderstorm frequency hasn’t increased:
Severe storms are more likely to form under certain conditions — including high wind shear and convective available potential energy (CAPE). Since 1979, parts of the eastern US have seen up to 15 more days with high CAPE during spring and summer — prime time for thunderstorms.
But CAPE is just one of several important factors in severe storm formation and it’s unclear how other factors such as wind shear could respond to future warming. Long-term trends show that the frequency of severe and tornadic thunderstorms hasn’t changed significantly since 1979 over multiple US regions.
Hail has possibly gotten more severe in some locations, but the data is inconclusive and there doesn’t seem to be a large-scale trend:
Overall, no clear overarching national climatological hail trend has been found for the USA, although recent evidence suggests the existence of regional positive trends in the frequency of very large hail.
Tornadoes also haven’t gotten more frequent, though there is change in where they’re occurring:
We show that national annual frequencies of tornado reports have remained relatively constant, but significant spatially-varying temporal trends in tornado frequency have occurred since 1979. Negative tendencies of tornado occurrence have been noted in portions of the central and southern Great Plains, while robust positive trends have been documented in portions of the Midwest and Southeast United States.
Tornado severity also doesn’t seem to be increasing, though there’s similarly some regional changes:
Our findings suggest an overall national significant decline in normalized losses from tornado events. At the country level, both the severity of damage from individual events and the total annual losses from tornadoes are seen to have reduced over time. We also find spatial variations in time trends for the damage from tornadoes: while for most U.S. states the declining trend in severity is confirmed, an increasing trend of total annual losses from tornadoes is observed for Alabama.

Wildfire frequency also hasn’t increased, although the size of fires has, and an increase in population living near the wildland-urban interface would be expected to make fires more destructive even if their frequency was unchanged.

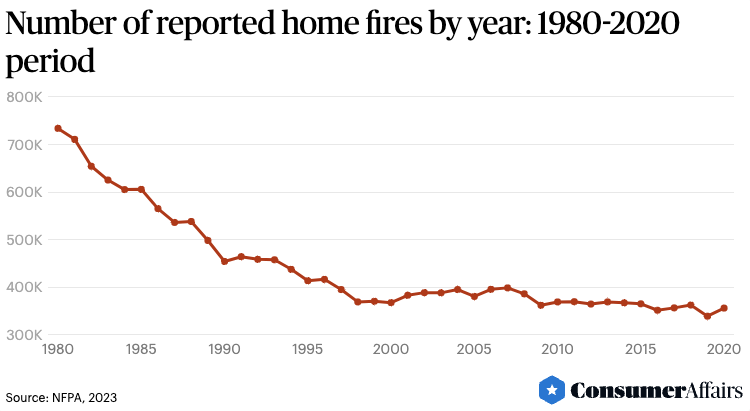
But this is somewhat balanced by the fact that house fires have gotten much less frequent:
So an increase in climate-related damage seems like it can do some of the work, due to things like increased wildfire risk and certain regions seeing more severe weather than they did historically. Is this enough to explain the nationwide increase?
One challenge with this explanation is that states typically require justification for an insurer raising their rates, and an insurer can’t necessarily compensate for rising risk in one state by raising premiums in another. This HBS study, however, suggests that this can happen by shifting costs from “high-friction” states where regulators are strict about premium increases to “low-friction” states where it's easier. One way to get a sense if this is happening is to look at changes in loss ratios state-by-state over time. If average loss ratios are decreasing in some states but premiums are still increasing, it suggests they might be carrying some of the burden from high-risk states.
This map shows the change in average loss ratio (a 5-year moving average) between 2000 and 2020. This is a messy metric, because even with a 5-year moving average a single bad year can dramatically shift averages, making it somewhat sensitive to your choice of starting and ending point. But it’s nevertheless illuminating. Some states, notably western states at risk of fire and some hurricane-prone states, have significantly increased their loss ratios, while in many other states they’ve decreased.

There’s also not any correlation to change in loss ratio and change in premiums-per-capita over time. States where loss ratios are increasing show similar premium changes to states where loss ratios are decreasing.
So this does suggest that the cost in high-risk states is being spread to other states, but this is a fairly noisy measure and it’s hard to be sure here. It also suggests that it's mostly fire risk, rather than hurricanes or thunderstorms, that’s being spread to other states.

Trends in types of losses
We can get a better sense of what’s driving insurance losses by looking at data from the Insurance Information Institute, which tracks homeowners insurance loss frequency and severity by type of loss going back to 2003. Here’s the inflation-adjusted average cost (5-year moving average) for an individual homeowners loss event, broken down by type of loss. Between 2005 and 2020, the cost of the average payout rose by 60%.
What’s notable here is that every type of loss has gotten more expensive, mostly in relatively similar proportions. The average damage cost for wind and hail, water, theft, other property, and bodily injury have all risen by about a factor of 1.5-1.7 since 2005. Fire damage, medical payments and credit card fraud have increased in severity more, with the average payout of the first two increasing by a factor of closer to 3 and credit card fraud seeing a single huge spike.
And here's the frequency of different loss types over time.
Most types of loss have gotten less frequent over time, often substantially. The frequency of fire damage, bodily injury, and other medical payouts fell by half or more. Theft fell by more than 2/3rds. And if you look at data that goes back farther, you see similar trends: while the severity (ie: payout size) of claims is rising, they’re getting paid out less frequently.
The two types of loss that have gotten more frequent is water damage and wind and hail. Water damage isn’t due to floods (which typically aren’t covered by homeowners insurance): water damage covers things like roof leaks, burst pipes, and water discharged from appliances. According to one insurer, this sort of damage is mostly from accidental water discharge, freezing pipes, and sprinkler failures.
Putting this data together gives us the annual expected loss from different types of events over time.
Theft and bodily injury expected losses have decreased, while every other type of loss has increased. Of these, the two major sources of increase are wind and hail (responsible for around 50% of the increase) and water damage (responsible for around 34% of the increase).
Conclusion
To sum up, homeowners insurance costs have risen steadily and substantially since the 1970s. Construction cost inflation and increasing home size can probably only explain a small portion of the increase. Insurers’ profits don’t seem to be a driver, and neither does state-level population shifts: the cost increases are across the board, in essentially every state.
Increasingly destructive weather events and climate-related disasters are probably part of the explanation, with the cost in risky regions being spread over the rest of the country, but it’s hard to tell how much this is occurring.
Looking at data from types of claims filed, the increasing frequency and severity of wind and hail damage is responsible for around half the increase in insurance losses over the past two decades, despite the fact that loss ratios in most wind and hurricane-prone states seem to be down. Fire risk is a relatively small portion of the increase. And another major source of increase isn’t anything related to climate at all, but due to the increasing frequency and severity of water damage.
Home size was corrected by using the median home size from the American Housing Survey. Household size and homeownership rate was corrected by using the number of owner-occupied homes from the American Housing Survey. Construction cost was corrected by using the Census cost index.
These data use “direct” values for premiums collected and costs and losses incurred. If you include indirect expenses (given in an Insurance Expense Exhibit, or IEE), profitability calculations are slightly lower.
Five-year moving average.
UPDATE: There was a significant data coding error in this analysis. In some of the Insurance Information Institute tables, the position of "wind and hail" and "water" is flipped, so some of the values got put in the wrong columns when I copied the data into a spreadsheet.
After correcting this, "water damage" is still responsible for a large chunk of the increase in expected losses (around a third), but now wind and hail damage is responsible for the largest portion (around half).
This is still somewhat confusing, since loss ratios are down in most wind and hail-prone states, but it's now confusing in a different way.
I wonder how you could add number of washrooms per household, as well as the percentage of homes with dishwashers, as well as fridges with icemakers/water dispensers over time to see if it is sinply the increased amount pf plumbing causing this? More plumbing per house is more chances for something to fail.
Anecdotally, the most common home insurance claim in people I know is either a dishwasher or water equipped fridge leaking.