

On Technologies vs. Commodities
A theory that has gained traction in the renewable energy space is that renewable energy sources like wind and solar are based on manufactured “technologies”, while fossil fuel energy sources like oil, coal, and natural gas are based on extracted “commodities”. Per this theory, technologies can take advantage of learning curves, and thus will continue to get cheaper as they’re deployed in larger and larger volumes; commodities, on the other hand, don’t have learning curves, and thus can’t be expected to get cheaper over time.
Here, for instance, is a report from the Rocky Mountain Institute advancing this theory:
There are two main perspectives on the energy transition: the old incumbent view of business-as-usual; and the new insurgent view of exponential change. At heart this is the longstanding battle of commodities versus technologies. Design and technologies beat commodities because they enjoy learning curves and are limitless. So costs fall over time, and growth is exponential. New energy comes from manufactured, modular, scalable, clean technologies; old energy is from centralized, heavy, dirty commodities.
This theory obviously favors increasing the rollout of renewable energy; the more renewables we build, the cheaper our energy will get, whereas if we stick with fossil fuels we can’t expect that to happen.
Folks referencing this theory seem to disagree as to the exact mechanisms that are driving the difference between price trends in technologies and commodities. The same Rocky Mountain Institute report suggests it’s because commodities have depletion dynamics and because cartels like OPEC can control the price:
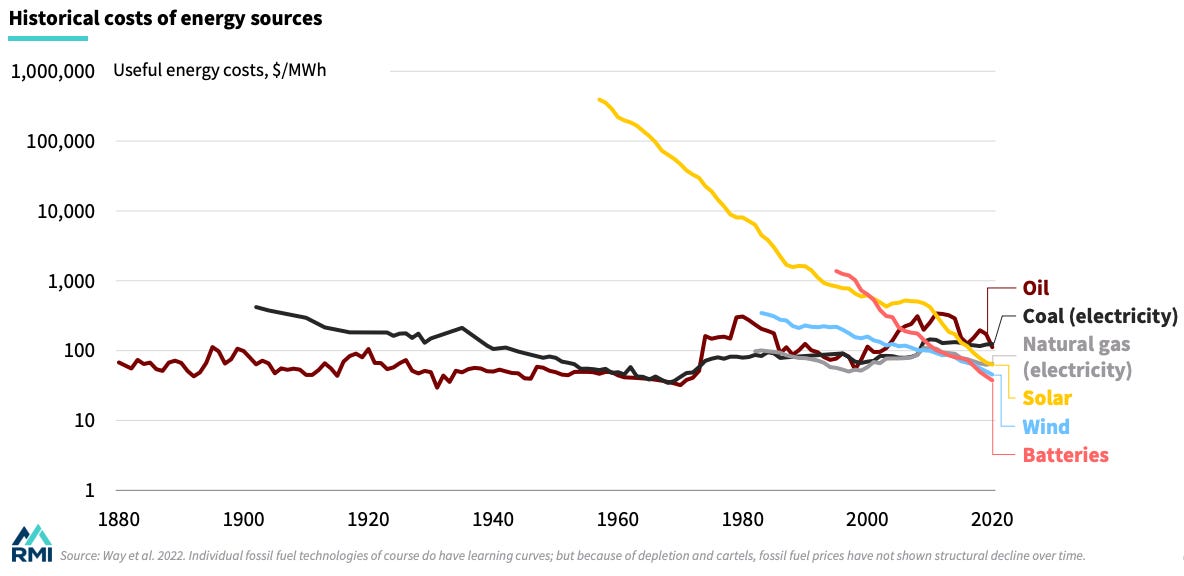
Individual fossil fuel technologies of course do have learning curves; but because of depletion and cartels, fossil fuel prices have not shown structural decline over time.
Someone else suggested to me that what this distinction is really getting at is elasticity of supply — that it’s much more straightforward to scale up the production of technologies than it is for commodities.
This 2011 paper from McNerney et al. on the historical price of coal-fired electricity suggests the difference is more about commodities being easily tradable:
Coal prices have fluctuated and shown no overall trend up or down; they became the most important determinant of fuel costs when average thermal efficiencies ceased improving in the U.S. during the 1960s. This fluctuation and lack of trend are consistent with the fact that coal is a traded commodity, and therefore, it should not be possible to make easy arbitrage profits by trading it. According to standard results in the theory of finance, this implies that it should follow a random walk. In contrast, plant construction costs, the most important determinant of capital costs, followed a decreasing trajectory until 1970, consistent with what one expects from a technology.
(I don’t think this makes a ton of sense — as we’ll see, something being tradable doesn’t preclude it from getting cheaper over time — but I wanted to flag it as a mechanism folks use to explain the difference between technologies and commodities.)
Regardless of the mechanisms, I think the “technologies vs. commodities” theory is, in practice, actually bundling a few different questions together:
To what extent can technologies and commodities be expected to decline in price over time?
Relatedly, to what extent are technologies and commodities subject to different dynamics that will affect their price?
And finally, do commodities exhibit learning curves — that is, does their price decline as a function of cumulative production volume?
Let’s look at each one of these questions and try to answer them.
Do commodities get cheaper over time?
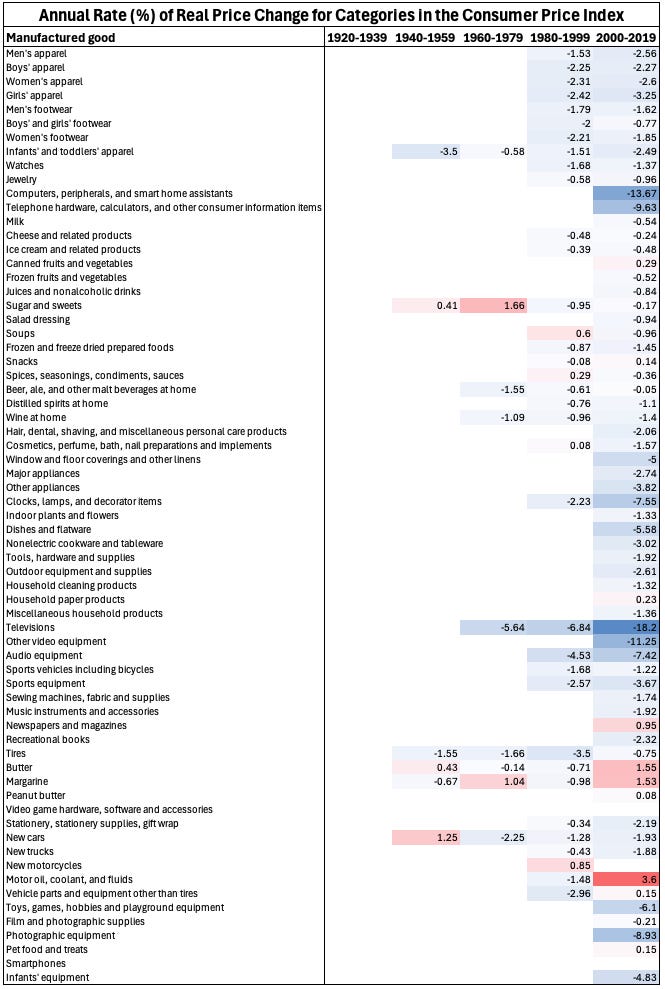
I think the idea that technologies (and more generally, manufactured goods) tend to exhibit declining prices over time is pretty clearly true. When Nagy et al. 2013 used the performance curve database to analyze cost trends for 62 different technologies, they found that Moore’s Law (prices decreasing exponentially with time) was nearly as good as Wright’s Law (prices decreasing exponentially with production volume) at predicting future prices. And if we create our own version of the famous AEI chart, and look at the cost trends of different categories of manufactured goods in the Consumer Price Index, we find that they almost all get cheaper in inflation-adjusted terms over time.
But as we noted last week, it’s also common for commodities to get cheaper over time. 24 of 25 different agricultural commodities we looked at got cheaper over their time series, and 60 of 93 different mineral commodities were. Even fossil fuels have historically exhibited long periods where they got cheaper over time — oil got cheaper for the hundred-year period from the 1860s to the 1960s.
The graph that the Rocky Mountain Institute uses to demonstrate that commodities don’t get cheaper in fact shows the price of coal-generated electricity falling by roughly a factor of 10 over a period of 70 years. This is by way of the “technology” of larger and more efficient coal plants, but it obviously deflates the technologies vs. commodities argument if in practice fossil fuel power can get cheaper over time by way of technological improvements, even if the fuel inputs themselves don’t.
However, historically manufactured goods do seem more likely to get cheaper over time. Below are graphs showing the average annual real price change for 124 different commodities, and for 67 different categories of manufactured goods in the Consumer Price Index, over 20 year windows of time. (So iron ore, which has price data from 1900 to 1921, is broken into price windows from 1900 to 1919, 1920 to 1939, etc. and an average rate of real price change is calculated for each window.) We can see that while both commodities and manufactured goods have a tendency to get cheaper over time (seen as a left skew on the graph), the tendency is greater for manufactured goods.
(Note that this isn’t a 1 to 1 comparison. Most manufactured good inflation data is post-1980, while the commodity price data in general stretches back much farther.)
The difference is even more stark if we just look at the 20-year period from 2000 to 2020. Manufactured goods still have a tendency to get cheaper, but commodities no longer do.
So contra the “technologies vs. commodities” theory, both technologies and commodities can get cheaper over time, but technologies seem to have more consistent price declines, particularly recently.
Do commodities and technologies have different price dynamics?
I think it’s true that there are, broadly, somewhat different dynamics at work when it comes to the prices of technologies vs. commodities. Commodities (as I noted last week, and as the Rocky Mountain Institute report argues) can be subject to depletion dynamics: getting used up in a particular location. And because they’re often found in specific locations, it’s perhaps easier to control the supply of commodities and use that control to manipulate the price. OPEC was famously able to effectively control the price of oil for many years, and De Beers was able to control almost the entire world’s supply of diamonds for over a century to keep prices artificially high.
But I think there’s also a significant amount of overlap in the price and production dynamics of technologies and commodities. Commodities mined from the earth are still a product of technology, of some particular process that gets used to extract, refine, and transport them. Like with manufacturing processes, this production process can be improved and made more efficient over time. The technology used to drill oil and natural gas wells has improved enormously over time thanks to the development of PDC drill bits and hydraulic fracking. These and other technical improvements have allowed oil producers to get more and more oil from fewer and fewer drilling rigs.
These productivity improvements haven’t cashed out as drops in the price of oil, but for other commodities process improvements have resulted in price declines. Most widely-used metal commodities — steel, aluminum, titanium — saw dramatic price declines following technological process improvements. (The introduction of the Bessemer process, the Hall-Herroult process, and the Kroll process respectively.)
Conversely, the depletion dynamics and diseconomies of scale that commodities can be subjected to can also be at work with technologies. Wind power may be a “technology” in the sense that it’s produced via repetitively manufactured wind turbines which need no consumable fuel, but a wind turbine needs to be installed somewhere where the wind is blowing, and there’s only so many places where the wind blows enough for wind power to be practical. Models of available wind resources in the US, for instance, show increasing cost of wind-generated electricity as deployment rises because the best, windiest sites get occupied first, and because wake effects from a wind farm can reduce the energy generated from adjacent wind farms. Actual deployment of wind turbines appears to be more complex than simply “the windiest sites get occupied first”, but reduced energy generation from wake effects is already an issue, and is projected to become more serious:
“We have seen wake effects for years, and knew they happen,” says Ouro. “The problem is that in order to achieve net zero, we need to deploy a given amount of offshore wind capacity. So for 2030, we need to have three times more capacity than we have now, which means that in less than five years, we need to deploy thousands more turbines,” he explains.
“[Some of] these turbines are going to be operating very close to those that are already operating, so things are getting more and more crowded. So these wake effects are now starting to have more impact,” he says.
Another important diseconomy of scale for wind and solar specifically is that as they get more widely deployed, they often become less popular. We see this dynamic with data centers, which used to be strongly favored by local communities (since they paid tax dollars but didn’t place much additional burden on local services) but now increasingly face opposition. And we’re seeing it with wind and solar, which are getting increasingly opposed by local residents. A 2023 report from Columbia notes that “local opposition to renewable energy facilities is widespread and growing, and represents a potentially significant impediment to achievement of climate goals.” A blog post from think tank R Street on wind energy permitting restrictions similarly notes that:
…when we compare new ordinances to wind power generation in the United States, we see a matching trend, indicating that wind ordinances are likely a response to the increasing likelihood of living near permitted wind power. This would be consistent with findings that counties with or near wind power are also most likely to adopt restrictions on the development of wind power.
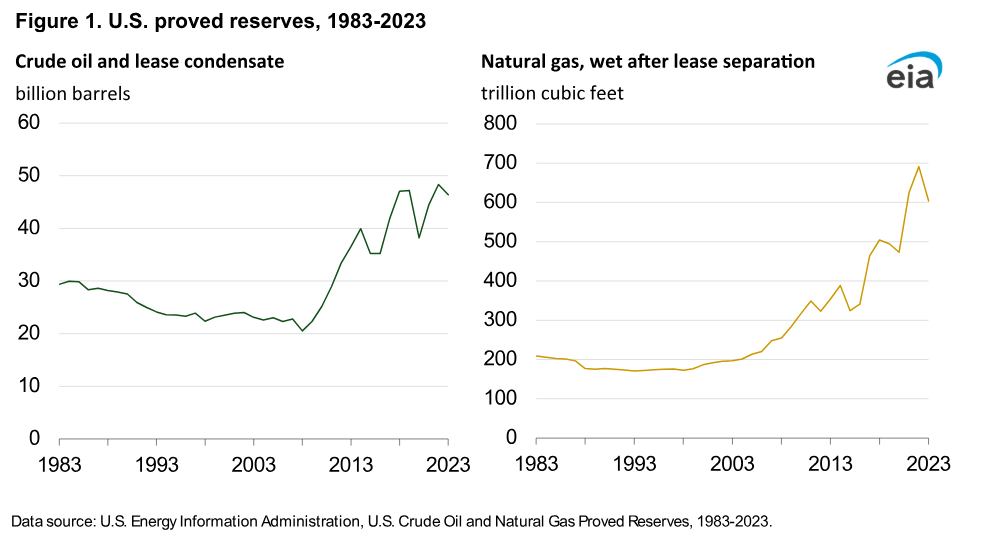
It’s possible to overcome or offset some of these dynamics technologically. Lower wind speeds, for instance, can be dealt with by using larger, taller wind turbines (up to the point where such turbines become infeasible to build on land due to transportation difficulties). Solar PV labor costs can be overcome by better automation for panel installation. But of course, it’s also possible to offset depletion dynamics technologically for commodities as well. Fracking is an obvious example, a technological development that made it possible to extract oil and natural gas from locations where it was previously infeasible or impractical to do so. Thanks to fracking, proven reserves of oil and natural gas in the US have actually increased since the year 2000.
Technologies can also be controlled by cartels, though my impression is that technology cartels are generally less successful than ones which try to control natural resources. The Phoebus light bulb cartel, which coordinated to artificially limit the lifespan of incandescent bulbs, only lasted for 14 years.
So in aggregate, there are probably somewhat different dynamics between commodities and technologies, but the boundaries between these categories are fairly fuzzy, and have a great deal of overlap. Commodity prices can decline over time thanks to technology improvements and economies of scale, and technologies can be affected by depletion dynamics and other diseconomies.
Do commodities have learning curves?
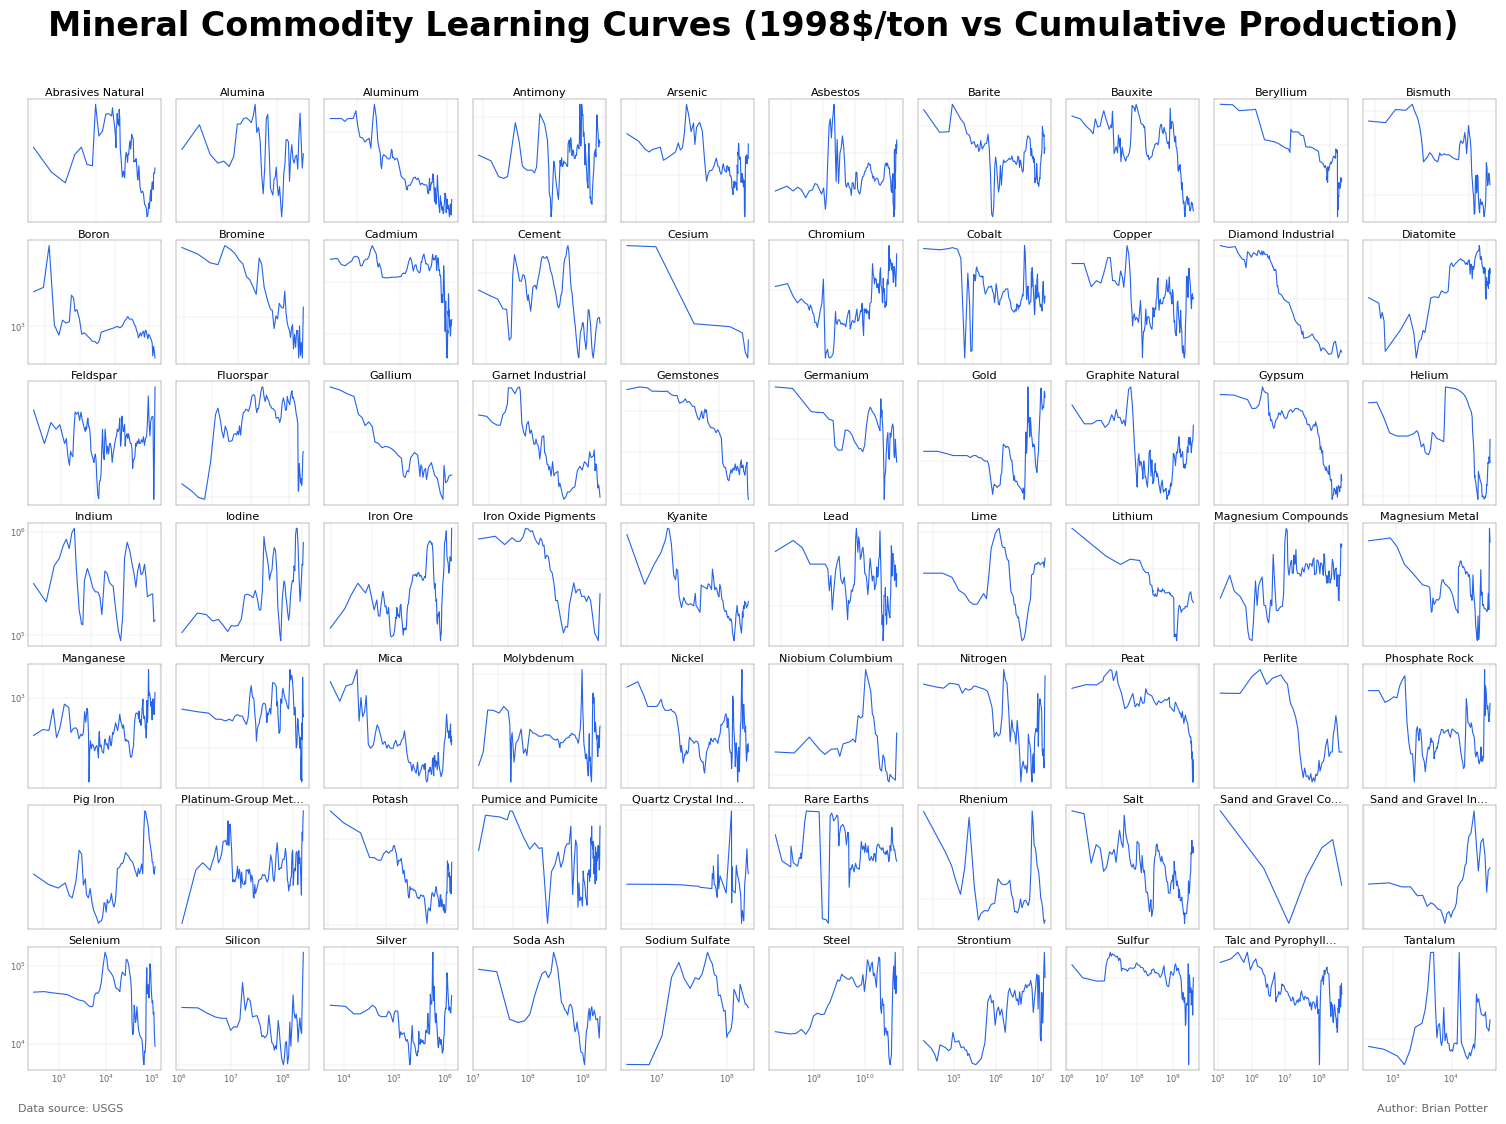
Determining if commodities have learning curves — that is, if they fall in price as a function of cumulative production volume — turns out to be a complicated question. If you just graph price vs. production volume data for various commodities, very few seem like they’re following any sort of learning curve, showing nice straight or mostly-straight lines going down and to the right on a log-log plot. The USGS mineral commodity datasets, include worldwide production volume for various mineral commodities going back to 1900. Some of these look like they’re following a learning curve, but most don’t.
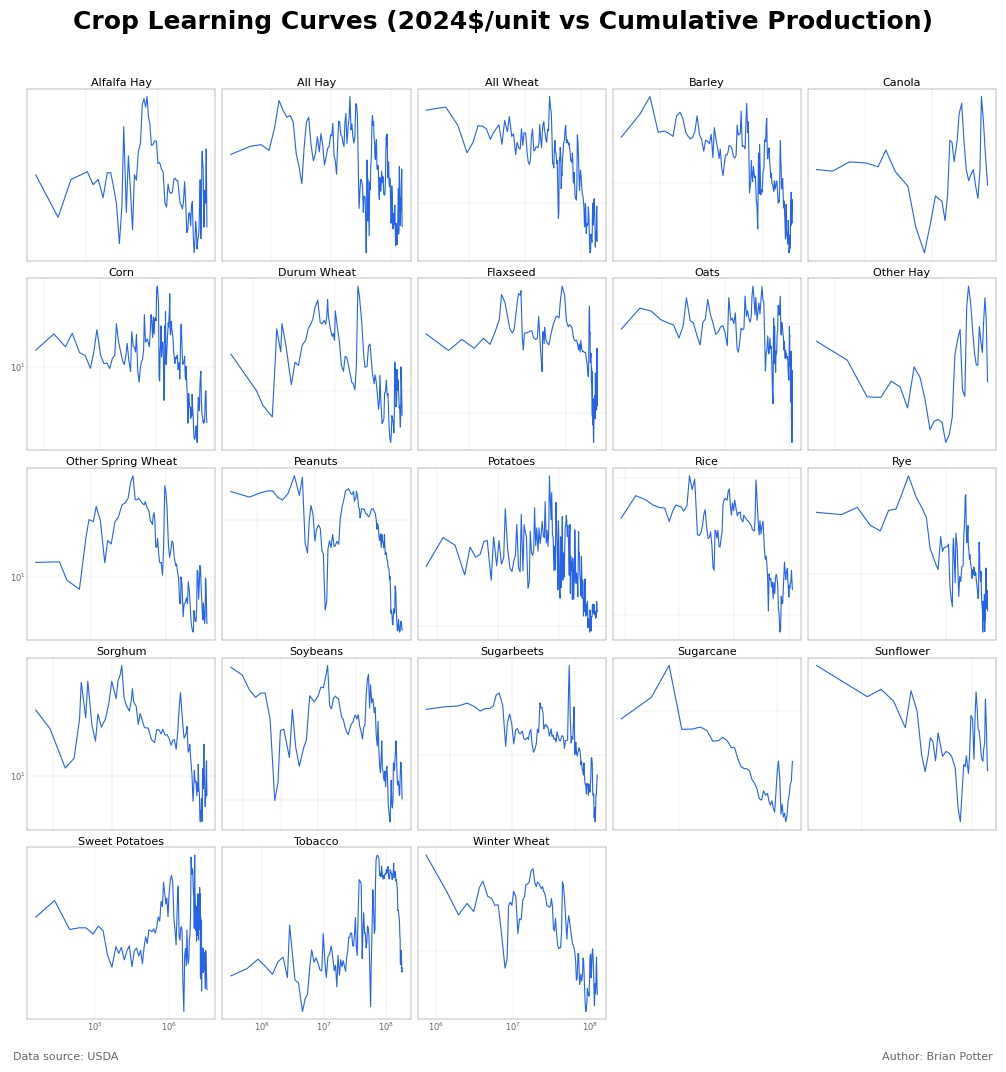
Similarly, USDA crop datasets include annual quantities harvested, which we can use to construct a learning curve. These look a little more like learning curves (they’re generally headed down and to the right), but they’re certainly not nice straight lines.
However, a major problem with these charts is that we’re not actually graphing price against cumulative production volume. Instead, we’re graphing price against production volume starting at some particular point in time. USGS mineral commodity data goes back to 1900, but most of those commodities were being produced long before 1900. Some minerals, like gypsum, copper, iron, and lime, have been mined for thousands of years.
Agricultural commodities have the same problem — crops were being harvested in the US long before the USDA datasets began. The learning curves above are thus missing a large amount of production that occurred prior to the beginning of the dataset.
If some amount of early production is missing from your learning curve dataset, this will distort the linear relationship between price and cumulative production on a log-log chart. Say you’ve produced 1000 units of something total. If you’re following a normal learning curve, you shouldn’t expect costs to fall very much over the next 20 units: going from 1000 to 1020 is only a small fraction of a doubling, and learning curves will (theoretically) have a constant percentage decrease in cost for every doubling of cumulative production volume. Thus a very small decline in price is expected. But what if production data is missing, and you think you’ve only produced 10 units instead of 1000. Now the next 20 units is a much larger fraction of production: you think you’re going from 10 to 30, more than tripling cumulative production. Now a very small decline in price looks like a very flat learning curve.
The graphs below show several learning curves. The first is the “true” learning curve with all the production data intact. The other graphs have various amounts of early production data missing, causing the graph to incorrectly start at an earlier point. The more production is omitted, the more the learning curve flattens out and deviates from the true curve. And it doesn’t take much omitted data to really distort the curves, so even the fact that most commodity use is fairly recent doesn’t rescue us from this problem.
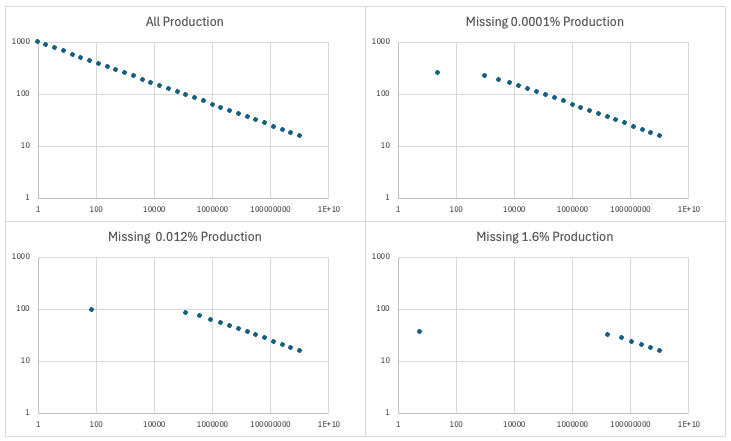
(Thanks to Matt Clancy for pointing this out.)
Because many commodities have been mined or harvested for centuries or millennia, it’s hard to get an accurate sense of what cumulative production volume truly is. This makes commodities different from technologies or manufactured goods, where it’s much easier to determine both when production started and what cumulative production is. Without good estimates of actual cumulative production volume, it’s hard to tell whether commodities follow learning curves or not.
Interestingly, for a few commodities where we can be confident we’re not missing much (if any) production volume, we often get something much more learning curve-like. Titanium metal, which basically didn’t exist prior to the 20th century, follows a nice learning curve. Aluminum was only produced in tiny amounts prior to the invention of the Hall-Herroult process, and also follows a nice learning curve.
This isn’t universally true. The USGS helium dataset probably covers almost all cumulative production (since helium wasn’t isolated until 1895), but its price history doesn’t appear especially learning curve-like, possibly due to government price controls or because it’s almost entirely a byproduct of natural gas extraction. But it nevertheless seems notable.
Conclusion
Overall I think the “technologies vs. commodities” theory gets at a real, meaningful distinction. Manufactured goods do seem more likely to decline in price over time than extracted commodities, and are probably broadly subject to somewhat different price dynamics. It’s also pretty unclear if commodities generally follow learning curves the way that manufactured goods do.
But this distinction is blurry, and in practice there’s a lot of overlap between the two categories. Both commodities and technologies can have falling prices thanks to efficiency-enhancing production improvements, and both can be subject to depletion effects or other diseconomies of scale. And at the limit, the price of some technology should approach the price of its raw material inputs, making it in effect a bundle of commodities. For energy technologies (the only place I’ve seen the “technology vs. commodity” distinction get made), there are also plenty of cases where the distinction breaks down. Hydropower isn’t commodity-based (in the sense that it doesn’t burn any fuel), but it also isn’t the product of modular, repetitively manufactured goods like wind and solar are. And it’s subject to severe depletion dynamics, since there’s only so many places you can build a hydroelectric dam.
(I also find the “technologies vs. commodities” concept sort of philosophically irritating, as every aspect of civilization, from manufactured goods to commodities like steel, oil, and corn, is a product of technology.)
So while I don’t think the distinction between technologies and commodities is meaningless, I also don’t think it does a particularly good job of carving reality at the joints. I think folks would be better served talking about the specific dynamics at work, and the specific problems that need to be solved, rather than thinking in terms of what, in practice, is a pretty fuzzy abstraction.
Thanks to Matt Clancy and Austin Vernon for reading a draft of this. All errors are my own.
Interesting article.
The renewable=technology and fossil fuels=commodity argument seems more like a PR attempt to increase government subsidies for renewables. And the logic is backwards. If renewables will drastically decrease in cost regardless, then there is no need for government subsidies.
Another excellent essay.